What Is a Technical Stock Screener and How Does It Work?
The best technical stock screeners help traders identify stocks based on price patterns, chart signals, and momentum indicators rather than company fundamentals.
Because technical traders focus on price action and timing rather than long-term valuation, these screeners are designed to surface stocks that meet specific technical setups.
You can customize filters such as RSI, moving averages, candlestick formations, or volume patterns to uncover tradeable setups faster and more efficiently.
For example:
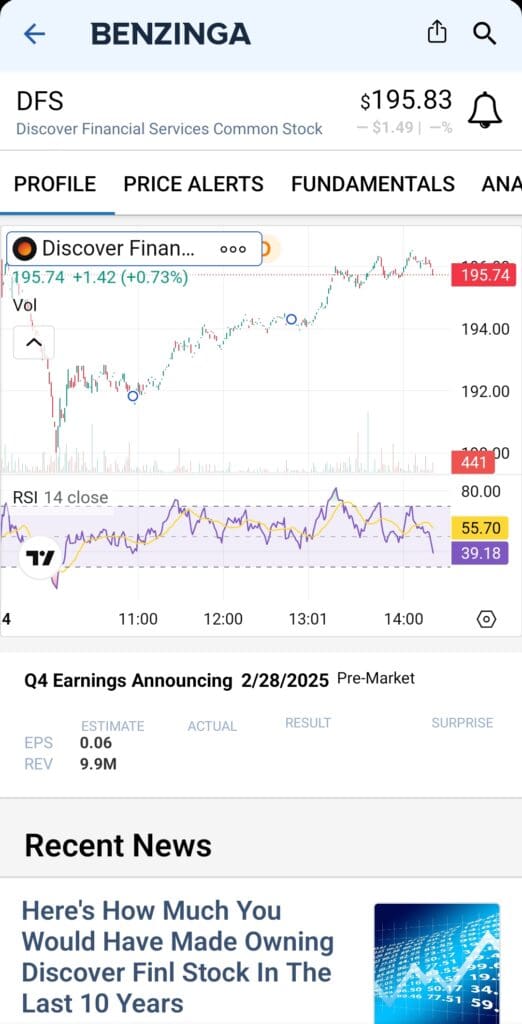
Filter by RSI or MACD Crossovers: A reading below 30 may suggest oversold conditions; a bullish MACD crossover can signal trend reversals.
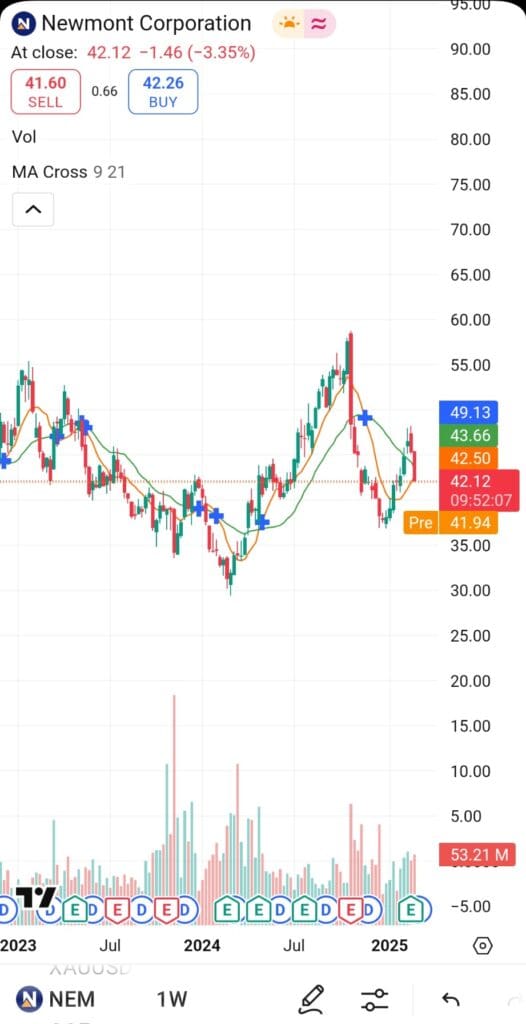
Scan for Moving Average Crosses: Look for stocks where the 50-day MA crosses above the 200-day MA to identify emerging uptrends.
Use Volume Indicators: Spot breakout momentum by screening for volume surges above the 20-day average.
Plan | Subscription | Best For |
|---|---|---|
TradingView Premium | $59.95
$432 ($23.98 / month) if paid annually | Technical Analysts |
Benzinga Pro | $37
$367 ($30.58 / month) if paid annually | News-Driven Traders |
MarketBeat All Access | $39.99
$399 ($33.25 / month) if paid annually | Portfolio Trackers |
GuruFocus Premium | $499 ($41.58/ month)
No monthly plan, price for US citizens, price change by region | Guru Investors Portfolios |
StockTwits Edge | $22.95
$229.50 ($19.10 / month) if paid annually
| Social Sentiment Traders |
Finviz Elite | $39.50
$299.5 ($24.96 / month) if paid annually | Chart Pattern & Backtesting |
Strategies to Screen for High-Potential Technical Stocks
Using a technical screener allows traders to zero in on stocks that meet precise momentum, volatility, or pattern-based conditions. Here are four actionable strategies to uncover setups with strong risk-reward profiles.
-
Spot Breakouts with Volume Confirmation
Breakouts are among the most reliable technical patterns, but they’re strongest when paired with volume surges.
Set Price Near Resistance Levels: Filter for stocks trading within 2–3% of 52-week highs or recent resistance zones.
Look for Volume Spikes: Apply filters for volume 1.5x to 2x above average over the last 10 days.
Confirm with Bullish Candlesticks: Add filters for bullish engulfing or marubozu candles for stronger confirmation.
For instance, if a stock breaks a multi-month resistance with double average volume and a bullish engulfing candle, it often signals institutional buying and continued momentum.
-
Find Oversold Stocks for Potential Reversals
This strategy works well for swing traders looking to enter short-term dips in a broader uptrend.
Use RSI and Stochastic Filters: Target stocks with RSI below 30 and stochastic below 20.
Include Trend Filters: Ensure the stock is still trading above its 200-day MA to avoid downtrending names.
Add Hammer or Doji Patterns: These candles near support can signal a reversal is forming.
Let’s say a tech stock pulls back to its 50-day support while RSI hits 28 and a hammer forms—this setup can offer a low-risk entry point if volume confirms a bounce.
-
Scan for Moving Average Crossovers
Moving average crossovers can indicate trend shifts, especially for trend-following or momentum traders.
Apply MA Crossover Filters: Filter for 50-day crossing above the 200-day (golden cross) or 20-day crossing the 50-day.
Combine with MACD Signal Line Cross: This strengthens confirmation for medium-term uptrends.
Limit to Stocks Above Key Support: Focus on names holding above recent breakout levels or long-term moving averages.
For example, when a stock forms a golden cross and MACD crosses into bullish territory, it often attracts trend-following funds and traders.
-
Target High Relative Volume for Short-Term Momentum
Traders looking for fast-moving setups can use relative volume to catch intraday or swing trade candidates.
Screen for Relative Volume Above 2.0: This suggests current volume is double the norm, indicating urgency.
Set Price Change Filter: Look for stocks moving 3–5% or more in the current session.
Avoid Low Float Illiquidity: Exclude stocks with average daily volume under 500,000 shares to reduce risk.
For instance, a mid-cap stock with relative volume of 3.1 and a clean breakout past resistance may signal a high-conviction move supported by strong buying interest.
-
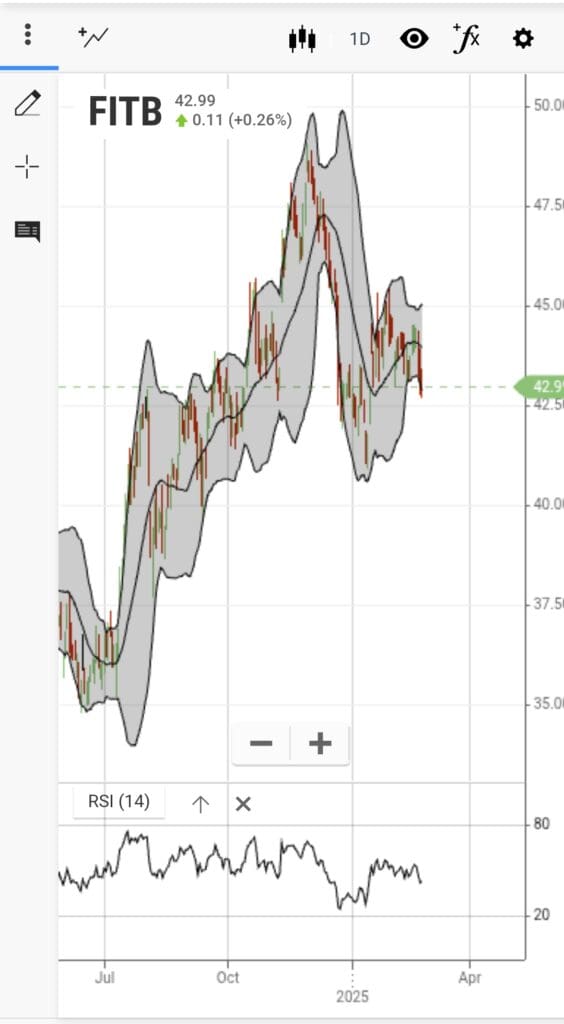
Use Bollinger Band Contractions for Breakout Setups
Bollinger Band squeezes can signal that a stock is building pressure for a breakout in either direction.
Screen for Narrow Band Width: Use filters that show Bollinger Band width at multi-week lows, indicating reduced volatility.
Add Volume Filters: Look for steady volume while price consolidates inside tight bands.
Filter for Upcoming Earnings or Events: These often trigger the volatility expansion after a squeeze.
Example: If a stock has compressed Bollinger Bands and reports earnings within the week, it may soon break sharply up or down. A screener helps you spot these setups in time.
-
Screen for MACD Divergence in Trending Stocks
MACD divergence can warn of potential reversals or strengthen conviction in trend continuation trades.
Look for Bullish Divergence: Price forms lower lows, but MACD forms higher lows.
Add Uptrend Confirmation: Include stocks above their 200-day MA to focus on strong names.
Use Histogram Filters: Set conditions for MACD histogram turning positive as an early signal.
This is particularly effective in stocks that have corrected within a strong trend, where MACD divergence may hint at momentum reentering.
-
Identify Gap-and-Go Setups for Intraday Plays
Gapping stocks with follow-through potential are popular among day traders.
Set Pre-Market Gap Filters: Use a screener that allows pre-market price gaps above 4–5%.
Filter by Relative Volume: Ensure volume is at least 2x the norm before the open.
Narrow to Mid-Caps: These often react more cleanly than microcaps to overnight news.
For instance, a stock gapping 6% higher on news with high pre-market volume and bullish momentum often attracts early buyers at the open.
-
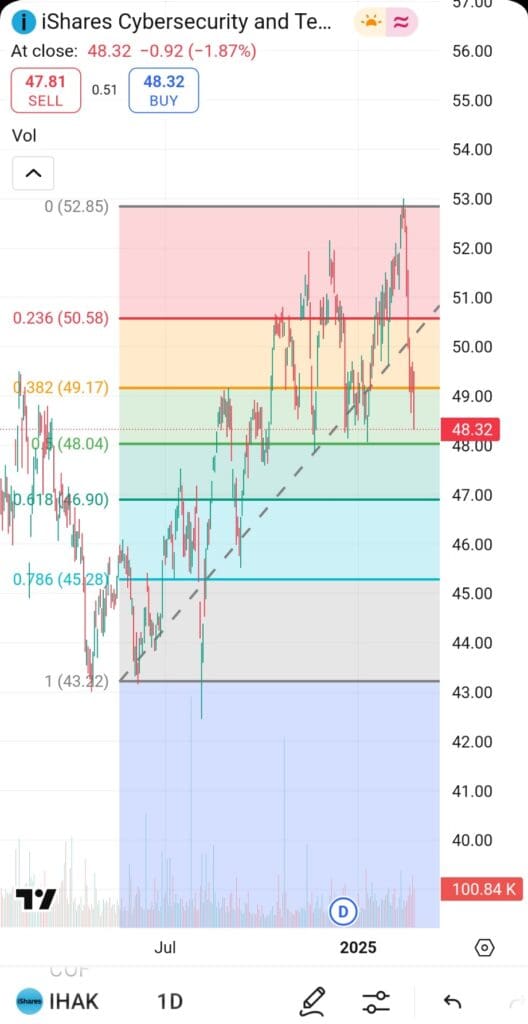
Look for Support Bounces at Key Fibonacci Levels
Many traders use Fibonacci retracement levels to time entries during pullbacks in uptrends.
Apply Retracement Filters (38.2% / 50% / 61.8%): Look for recent pullbacks to these zones from a local high.
Add Bounce Confirmation: Include bullish reversal candles forming near the retracement level.
Combine with RSI or Stochastics: Helps confirm the oversold bounce potential.
For example, a pullback to the 61.8% level after a strong rally, followed by a bullish engulfing candle, often attracts technical traders anticipating a rebound.
-
Filter for Multi-Timeframe Alignment
Traders gain confidence when short-term and long-term charts align in direction.
Look for Stocks in Weekly and Daily Uptrends: Use filters that combine both timeframes showing higher highs and higher lows.
Add Short-Term Pullback Criteria: For example, price pulling back to the 20-day MA within a weekly uptrend.
Confirm with Momentum Indicators: Use MACD or RSI remaining in bullish zones on both timeframes.
This strategy helps you enter pullbacks in strong trends with less risk of counter-trend moves—ideal for swing trading.
How to Choose the Right Technical Stock Screener
Not all screeners offer the same level of depth, so selecting the right one depends on your trading style and goals.
Look for Real-Time Data Access: For day or swing traders, real-time quotes and updates are essential for timely trade execution.
Ensure Custom Indicator Support: Choose a screener that allows filters for RSI, MACD, moving averages, and candlestick patterns you actually use.
Check Multi-Timeframe Scanning: This helps align short-term setups with broader trends for higher-probability trades.
Evaluate Usability and Visualization: Platforms like TradingView offer visual tools that show chart patterns as you filter, improving speed and accuracy.
A strong technical screener should save time, support your strategy, and let you act on setups quickly—not slow you down with limited filters or delayed data.
Plan | Subscription | Best For |
|---|---|---|
Morningstar Investor | $34.95
$249 ($20.75 / month) if paid annually | Retirement Planners |
Zacks Premium | $249 ($20.75/month)
No monthly plan | Research-Driven Investors |
Motley Fool Stock Advisor | $199 (16.60 / month)
No monthly plan
| Stock Picks |
Yahoo Finance Gold | $49.95
$479.40 ($39.95 / month) if paid annually | Casual Investors |
InvestingPro | $15.99
$120 ($9.99 / month)
if paid annually | Global Market Investors |
TipRanks Premium | $359 ($30 / month)
No monthly plan | Analysts Followers |
Seeking Alpha Premium | $299 ($24.90 / month)
No monthly subscription | Research-Oriented Investors |
Mistakes To Avoid When Using a Technical Stock Screener
Technical screeners are powerful, but misusing them can lead to missed opportunities or poor entries. Here’s what to avoid.
Using Too Many Filters: Over-filtering can exclude quality setups. Keep criteria simple and focused on your top 2–3 signals.
Ignoring Volume Trends: Price moves without volume are unreliable; always include a volume or relative volume filter for confirmation.
Forgetting to Adjust for Timeframe: A setup on the daily chart may fail on the hourly—always match your screener to your trading timeframe.
Chasing Every Signal: Screeners find setups, not guaranteed trades. Use them as a starting point, then confirm with your full analysis process.
Avoiding these mistakes will help you stay focused, reduce false signals, and improve your consistency with technical strategies.
