Table Of Content
What Is the Interactive Brokers Stock Screener?
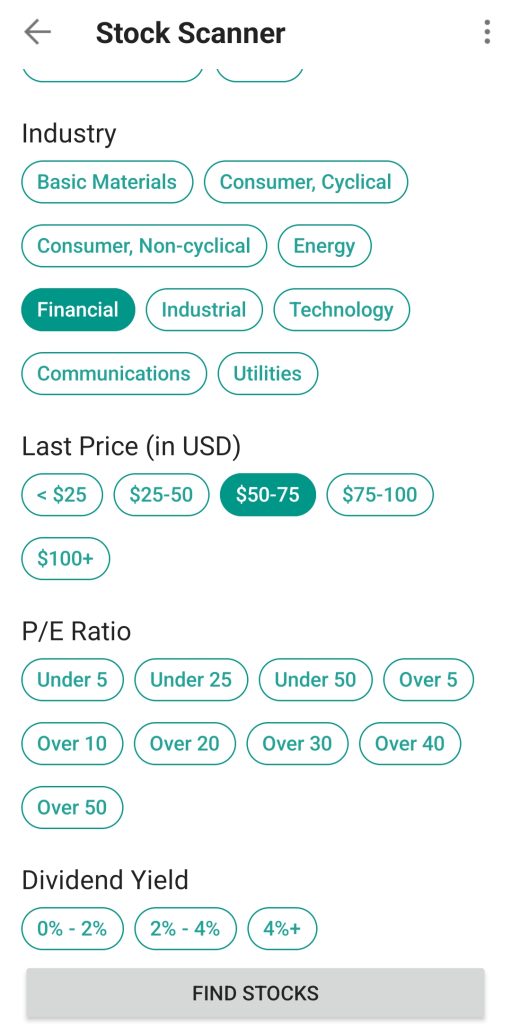
The Interactive Brokers (IBKR) stock screener is a powerful research tool built into the Trader Workstation (TWS) and Client Portal platforms, helping investors filter stocks using a wide range of technical, fundamental, and custom metrics.
Unlike basic screeners, IBKR’s version caters to both long-term investors and active traders.
It allows you to scan global markets using real-time data, custom ratios, analyst ratings, and even environmental or ESG filters — all from a single dashboard.
We used it to build screens for undervalued dividend payers, small-cap breakouts, and even high-growth tech stocks — and the flexibility was impressive.
Because you can combine technical and fundamental filters, it’s a great tool whether you're scanning weekly or actively day trading.
Mastering IBKR’s Screener: Key Strategies for Investors
To get the most from IBKR’s screener, you need more than just filters — you need a clear objective and a process. Here’s how we approached it during real usage.
-
Define Your Investing Framework First
Before jumping into filters, we found it useful to set an investing goal. The screener’s power can feel overwhelming without clarity. So ask yourself: are you looking for momentum trades, stable dividend stocks, or undervalued growth?
Examples of useful filter combos:
For growth stocks: Filter for revenue growth > 10%, EPS growth > 15%, PEG ratio < 1.5.
For income investors: Screen for dividend yield > 3.5%, payout ratio < 65%, and low debt/equity.
For deep value: Use P/B < 1, forward P/E < 12, and ROE > 10%.
When we ran a dividend screen using these rules, we got a focused list of high-quality names instead of sifting through random tickers.

-
Scan Weekly — But Let the Data Breathe
Because IBKR includes real-time metrics and technicals, it's tempting to run screens every day. But we found that scanning weekly or around earnings cycles gave better context and fewer false positives.
Best times to screen:
Post-earnings season: Use recent changes in analyst ratings and valuation.
Weekly market reviews: Combine technicals like RSI or MACD to catch setups.
Sector rotations: Adjust filters to overweight sectors like energy, tech, or utilities based on macro shifts.
For example, during a market dip, we used the screener to find large-cap stocks with RSI below 30 and strong fundamentals — catching a few rebounds early.
-
Leverage Valuation and Technical Signals Together
One advantage of IBKR is that it lets you combine technical patterns with valuation metrics — ideal for traders and long-term investors.
Smart screen combinations we tested:
MACD crossover + low P/E: Catch undervalued stocks just starting to trend.
Price below 200-day MA + high ROE: Find fundamentally strong stocks that are temporarily beaten down.
Short float > 15% + positive EPS revisions: Screen for short squeeze candidates with improving fundamentals.
This hybrid approach helped us avoid overbought traps while identifying real opportunities.
-
Use Financial Strength Metrics to Avoid Traps
Screening based on low price alone is risky. That’s why we combined profitability, cash flow, and balance sheet filters in our screens to protect against value traps.
Metrics we consistently relied on:
Current ratio > 1.5 for liquidity safety.
Positive free cash flow over trailing 12 months.
Return on invested capital (ROIC) > 10%.
Net margin and operating margin > industry average.
One screen using ROIC + free cash flow + low debt quickly flagged industrial stocks that were solid even during downturns.

-
Track and Save Screens for Repeatable Success
Interactive Brokers lets you save screens and track past results over time — something we used to refine strategies monthly.
Best practices from our experience:
Save one screen per goal — like “dividend growth,” “undervalued tech,” or “breakout setups.”
Revisit screen results after earnings or macro news and compare how your top results performed.
Create alerts for specific screen triggers — like RSI drops or earnings beats — so you’re not constantly re-checking manually.
Over time, this helped us create a repeatable strategy instead of building random watchlists from scratch.
How Interactive Brokers’ Screener Helps Smart Investors
What stands out with IBKR is its depth and flexibility — it’s not just a fundamentals screener. You can screen stocks with custom formulas, pre-built templates, or your own technical conditions.
Key strengths of the IBKR screener:
Advanced Filtering for Fundamentals and Technicals: You can screen based on P/E, ROE, market cap, or add real-time indicators like RSI, MACD, or moving averages.
Multi-Asset and Global Reach: Screen stocks, ETFs, options, and even bonds across dozens of exchanges — including U.S., Europe, and Asia.
ESG and Analyst Ratings: IBKR integrates ESG scores and third-party analyst opinions, helping you filter for quality or ethical investing.
Custom Logic and Alerts: Save custom screens with formulas like “Price < 20-day MA AND RSI < 40” and receive alerts when conditions are met.
Additional Interactive Brokers Screener Tools to Try
While the core screener is powerful, we found a few advanced features especially useful:
Scanner Library: IBKR includes dozens of ready-made screens based on analyst upgrades, insider activity, or momentum ideas.
Market Scanner in TWS: For traders, this tool enables fast scans using real-time price action across U.S. and global markets.
Custom Formulas: You can build your own filters using logic (e.g., “EPS growth > 10 AND RSI < 40”) — helpful for backtesting.
ESG Filters: IBKR sources data from Refinitiv and other providers, allowing screens that align with ethical or impact investing.
These tools add depth to your research and make IBKR ideal for advanced investors.
Top Alternatives to Interactive Brokers’ Screener
While IBKR’s screener is one of the most advanced, some investors may prefer simpler screener interfaces or unique features found elsewhere:
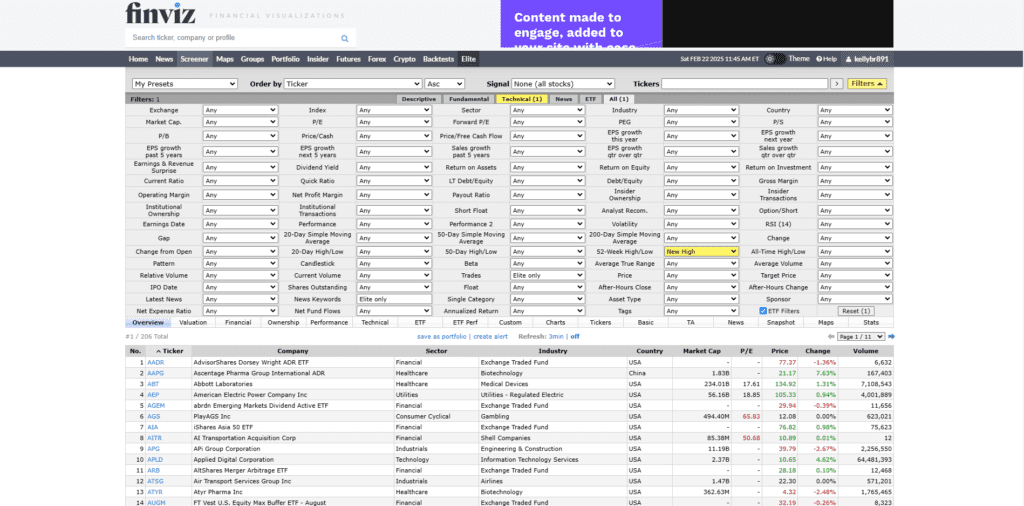
Finviz Elite: Great for quick scans using technicals and fundamentals. It’s faster, but less customizable than IBKR.
TradingView Stock Screener: Excellent for visual traders who rely on chart setups and community-shared strategies.
Zacks Premium Screener: If you're focused on analyst ratings and value metrics, Zacks offers fundamental-heavy screens with proprietary rank scores.
Plan | Subscription | Best For |
|---|---|---|
Morningstar Investor | $34.95
$249 ($20.75 / month) if paid annually | Retirement Planners |
Zacks Premium | $249 ($20.75/month)
No monthly plan | Research-Driven Investors |
Motley Fool Stock Advisor | $199 (16.60 / month)
No monthly plan
| Stock Picks |
Yahoo Finance Gold | $49.95
$479.40 ($39.95 / month) if paid annually | Casual Investors |
InvestingPro | $15.99
$120 ($9.99 / month)
if paid annually | Global Market Investors |
TipRanks Premium | $359 ($30 / month)
No monthly plan | Analysts Followers |
Seeking Alpha Premium | $299 ($24.90 / month)
No monthly subscription | Research-Oriented Investors |