
Investing.com (Free Plan)
Monthly Subscription
Promotion
Our Rating
Best For
- Overview
- Features
- Pros & Cons
The Investing.com Free Plan is a solid starting point for investors and traders looking for a comprehensive, no-cost platform to track the markets, analyze stocks, and stay updated on financial news.
The free plan includes a customizable watchlist, economic calendar, and access to a basic stock screener, making it a useful tool for both beginners and more experienced investors looking for fundamental market insights.
What we liked about the free plan is its wide market coverage and the fact that it offers real-time data without requiring a subscription, which is something that many competitors, like Yahoo Finance, limit in their free version.
However, the free plan provides strong fundamental data but lacks deeper customization options and premium analytics.
- Stock Screener
- Stock Analyst Ratings
- Real-Time Market Data
- Interactive Financial Charts
- Technical Analysis Summary
- Company Financials Data
- Portfolio Management
- Financial News & Analysis
- Economic Calendar
- Alerts & Notifications
- Currency Converter
- Basic Fundamental Data
- Real-time market data
- Comprehensive free stock screener
- Wide market coverage
- Customizable watchlist & alerts
- Includes economic calendar
- Limited stock screener filters
- No advanced portfolio tracking
- No in-depth analyst reports
- Ads in free version
- Lacks AI-powered recommendations
How To Research Stocks With Investing.com Free Plan?
We explored Investing.com’s stock research tools. Then, we tested these features to see how they perform in real-time, how useful they are for everyday investors, and where they fall short.
Here are the leading research stocks we found – and what we think about them:
-
Stock Screener
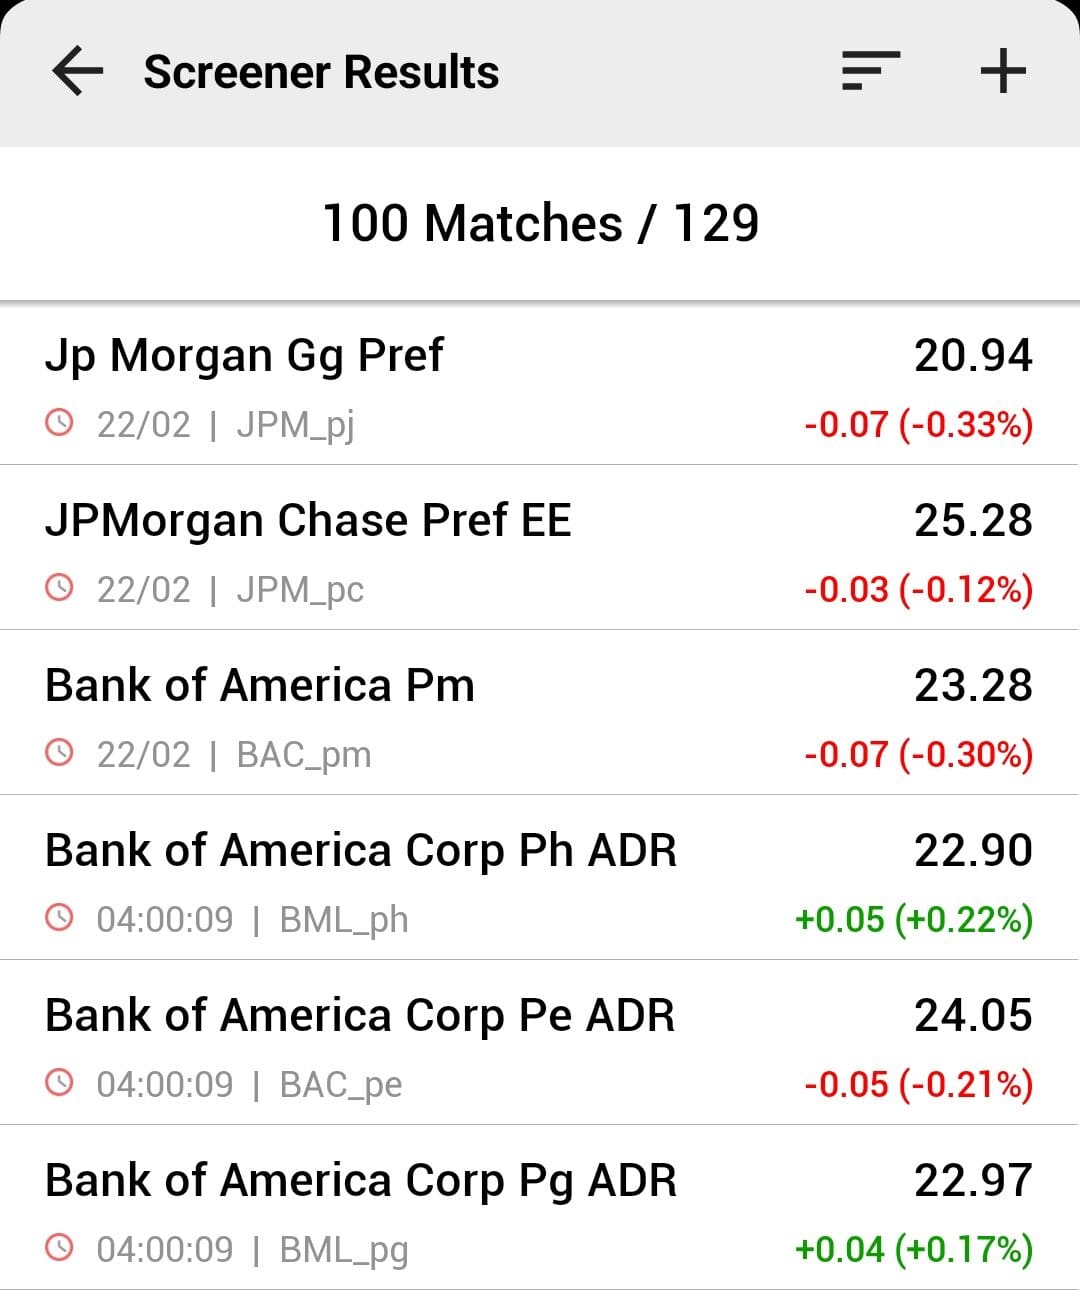
The free plan provides access to a basic screener that lets users search for stocks by price range, industry, market cap, sector, and a few fundamental metrics.
This tool is particularly useful for beginners who want a starting point for stock research without manually going through individual stocks.
By adjusting the filters, investors can identify undervalued stocks, high-growth companies, or dividend-paying stocks based on their preferences.
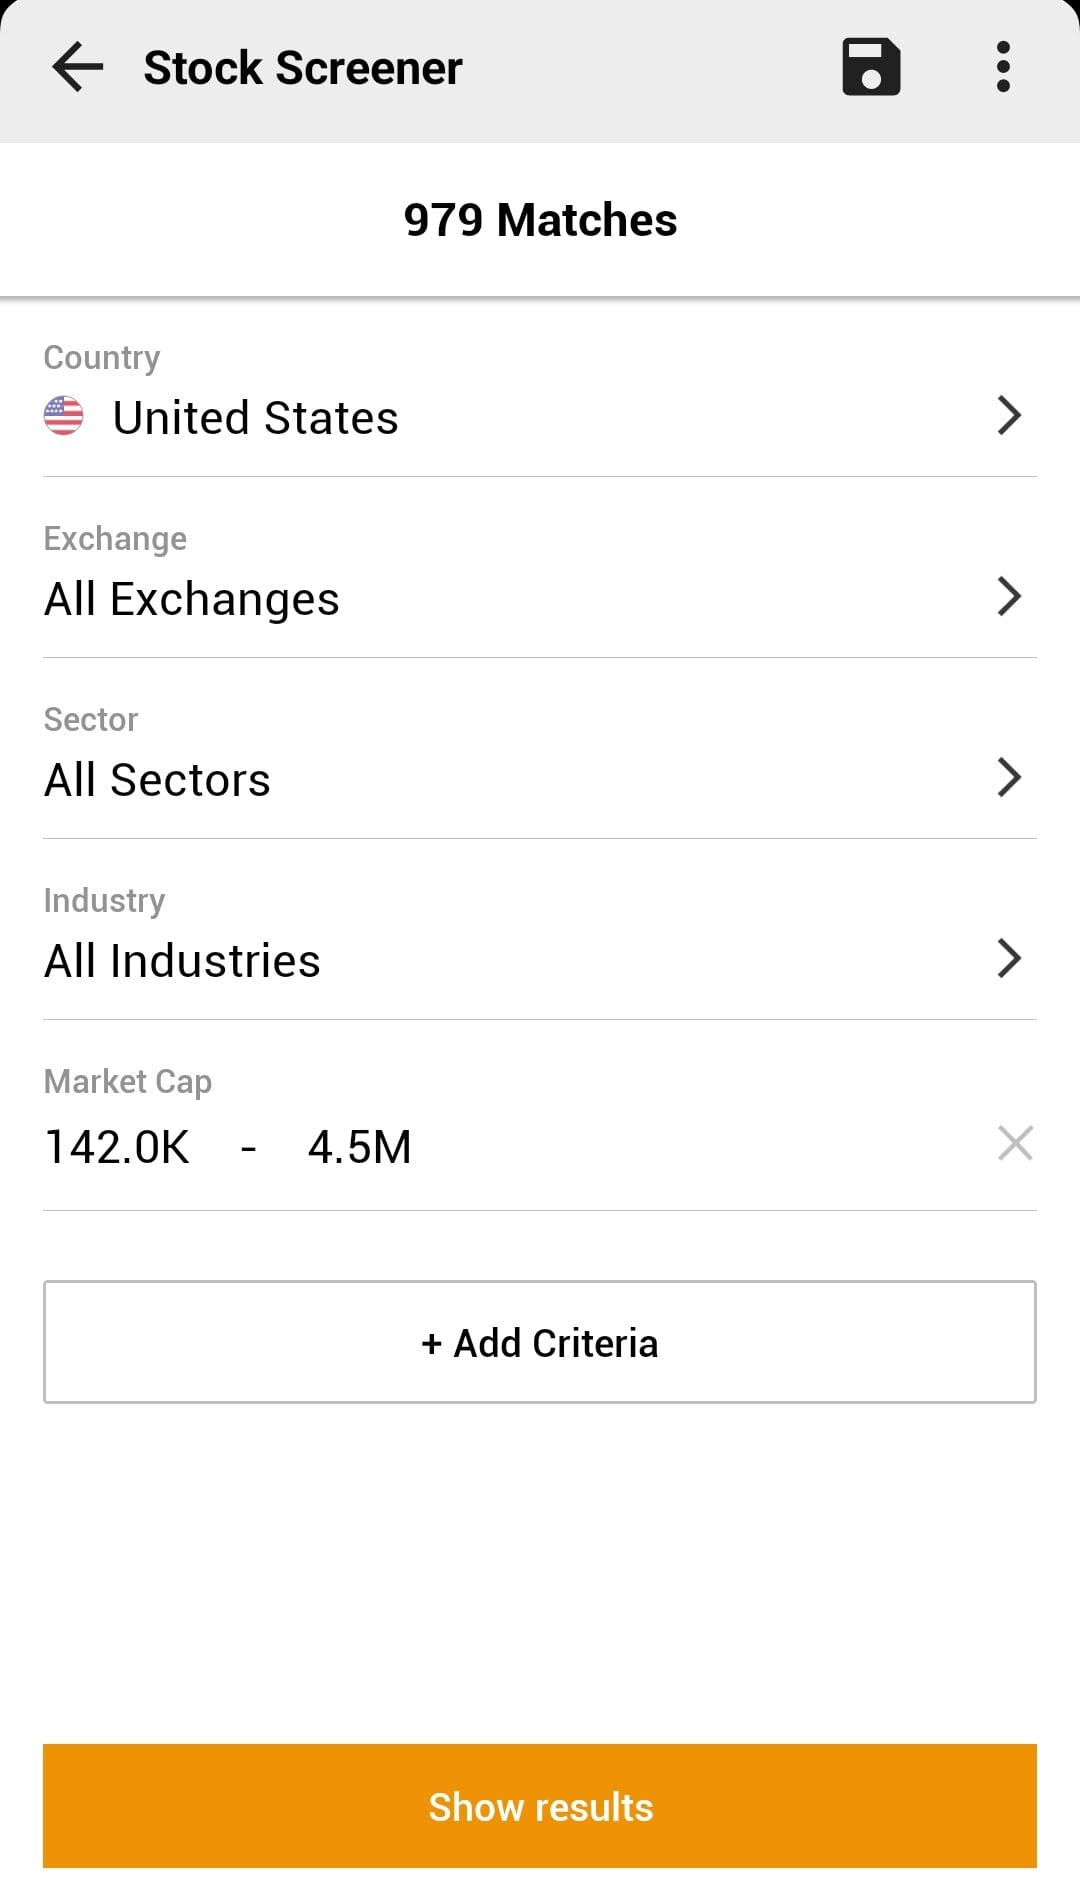
The Stock Screener helps traders filter stocks based on technical indicators like RSI, moving averages, MACD, and price performance.
However, the free version of the stock screener offers basic filtering options. Advanced metrics and more granular filters are reserved for premium subscribers, limiting the depth of analysis for free users.
-
Limited Stock Analyst Ratings
Another way to choose stocks is by stock recommendation. While investing.com doesn't provide such a service in the free plan, there is a section of rating analysts that helps readers to see how professionals rate their stocks.
Investing.com's Stock Analyst Ratings feature provides up-to-date information on expert opinions, including upgrades and downgrades of various stocks.

This tool helps investors gauge market sentiment and make informed decisions by presenting professional analyses and recommendations.
For example, an investor considering adding a particular stock to their portfolio can check its recent analyst ratings.
-
Real-Time Market Data
Real-time data is crucial for tracking market movements, identifying trends, and executing trades at optimal times.
Investing.com provides real-time market data across various financial instruments, including stocks, indices, commodities, and currencies.

How To Analyze Stocks With Investing.com?
Investing.com provides a variety of tools to help investors and traders make smarter financial decisions.
Whether you're analyzing stocks, managing a portfolio, or tracking market trends, the platform offers both technical analysis features and fundamental data insights.
-
Interactive Charts For Technical Analysis
The Interactive Financial Charts on Investing.com allow users to visualize the performance of various financial instruments, including stocks, indices, commodities, and currencies.

These charts are customizable, enabling users to select different time frames, chart types (such as candlestick, line, or bar charts), and apply numerous technical indicators.
This flexibility helps traders and investors analyze historical data and identify potential market trends.
-
Technical Analysis Summary
The Technical Analysis Summary provides a real-time overview of various technical indicators and moving averages for selected financial instruments, mainly stock indexes and currencies.
This feature aggregates data from multiple indicators to offer a consolidated “Buy,” “Sell,” or “Neutral” signal, assisting users in making quick assessments of an asset's potential direction.
-
Company Financials Data
The Company Financials section provides detailed financial statements, including income statements, balance sheets, historical earnings reports, future earnings forecasts, cash flow statements, and many more.

By examining these documents, investors can assess a company's profitability, liquidity, and overall financial stability.
This information is crucial for evaluating a company's performance over time and comparing it to industry peers.
-
Portfolio Management
Investing.com’s portfolio management tools allow users to monitor financial instruments and track their holdings in real-time.
Investors can track their entire portfolio in one place, keeping an eye on real-time price changes, performance trends, and market fluctuations.
Investors can also create and manage multiple watchlists to follow stocks, funds, indices, currencies, and commodities.
The platform offers cross-device access, meaning users can view their portfolios on PC, tablet, or phone.
Additional Features & Tools
We found some additional useful tools for investors and traders:
- Financial News and Analysis: Regular updates and expert analyses on global markets keep investors informed about the latest developments, aiding in the assessment of market conditions and investment opportunities.
- Economic Calendar: This tool provides a schedule of upcoming economic events and indicators, helping investors anticipate market movements and plan their strategies accordingly.

- Alerts and Notifications: Investors can set up alerts for specific price levels, news updates, or technical indicators, ensuring they stay informed about significant changes affecting their investments.
- Currency Converter: A handy tool that allows users to convert currencies based on real-time exchange rates, useful for investors dealing with multiple currencies or assessing forex investments.

What’s Missing In Investing.com Free Plan?
The Investing.com Free Plan is a great starting point for investors and traders.
While it provides a solid base, we found areas where it could be improved, especially for those who need deeper data insights, customization, and an ad-free experience.
-
No Advanced Stock Screener Features
The free stock screener allows basic filtering based on price, market cap, and a few fundamental metrics, but it lacks more advanced screening options.
For example, free users cannot filter by advanced valuation metrics, in-depth financial ratios, or custom screeners that factor in both fundamental and technical indicators.
Other platforms, like Finviz and TradingView, offer more robust free screening tools. If Investing.com added more fundamental and technical filters, even at a basic level.
-
No In-Depth Analyst Reports Or Stock Advisory
The free plan does not include detailed analyst reports or stock fair value calculations, which are crucial for long-term investors trying to assess whether a stock is overvalued or undervalued.
Also, there is no option to get recommendations on stocks (it is available with inevsting.com pro and pro+ plans)
-
No Advanced Portfolio Analysis
Investing.com allows users to track their holdings and monitor price movements, but the portfolio management tools are quite basic in the free plan.
However, investors cannot analyze portfolio performance over time, measure risk-adjusted returns, or view historical portfolio trends.
Who Can Benefit Most From Investing.com?
The Investing.com Free Plan is a great starting point for different types of investors and traders.
Here’s who may benefit the most:
Casual Investors & Beginners – If you're just starting out and want to track stocks, monitor trends, and learn basic technical and fundamental analysis, the free plan offers plenty of features to get you going.
Market Watchers & Researchers – If you like following stock movements, economic events, or checking financial news, the free plan provides enough data and alerts to stay informed.
Part-Time Traders – Swing traders or occasional traders who don’t rely on real-time alerts or advanced indicators can still benefit from free charts and market updates.
However, if you need deep stock analysis, AI-powered recommendations, real-time market data, or advanced screeners, upgrading to Pro or Pro+ might be a better fit.
Which Investors May Need More Features?
While the Investing.com Free Plan is great for casual investors, it may not be the best fit for traders or investors who need more advanced tools and data.
Here’s who might find it lacking:
- Day Traders & Active Traders – Delayed pricing on some exchanges makes it unsuitable for fast-paced trading. Real-time tick data and custom alerts require Pro or Pro+.
- Fundamental Analysts – Lacks deep financial reports, AI-driven stock insights, and 10+ years of historical data for in-depth company analysis.
- Portfolio Performance Trackers – No risk-adjusted return analysis, historical performance tracking, or asset allocation insights for detailed portfolio evaluation.
- Options & Futures Traders – Missing advanced derivatives tools, like options chains, implied volatility tracking, or specialized futures analysis.
Should I Upgrade?
The Investing.com Free Plan offers a solid foundation it lacks many of the advanced tools available in the Pro and Pro+ plans.
One significant gap is real-time market data. While the free plan offers real-time quotes for some assets, certain exchanges. In contrast, Pro and Pro+ provide fully real-time data, eliminating delays.
Stock research tools also differ significantly. The free plan offers basic analyst ratings and financial data, but it lacks deep stock fair value analysis, earnings forecasts, and company health scores that Pro and Pro+ provide.
Plan | Monthly Subscription |
|---|---|
InvestingPro | $15.99
$120 ($9.99 / month)
if paid annually |
InvestingPro+ | $39.99
$300 ($24.99 / month) if paid annually |
Similarly, the stock screener in the free version is limited to basic filters, whereas Pro+ unlocks 1,200+ fundamental metrics, advanced screeners, and customizable financial models.
When it comes to stock recommendations, the Pro and Pro+ plans deliver enhanced stock advisory features, including AI-driven picks, expert insights, and access to successful investment strategies, catering to investors seeking comprehensive guidance.
FAQ
Premium content and features are exclusive to InvestingPro and InvestingPro+ subscribers; Free Plan users have access to a broad range of basic tools and information.
Yes, users have access to free trading guides and tutorials to enhance their financial knowledge.
Users can access real-time quotes, customizable watchlists, interactive charts, financial news, and basic technical analysis tools.
The Free Plan includes advertisements and lacks advanced features such as in-depth stock analysis, AI-driven insights, and ad-free browsing.
Review Free Stock Analysis Tools


Investment Analysis & Research Tools : Review Methodology
At The Smart Investor, we evaluated free investment research platforms based on the quality and depth of their features compared to other free alternatives. Each platform was rated based on the following criteria:
- Fundamental Analysis Tools (25%): We assessed the availability of key financial data, including income statements, balance sheets, cash flow, valuation metrics, and analyst estimates. Platforms with more in-depth historical data, forward-looking projections, and research reports scored higher.
- Technical Analysis Features (20%): We examined the variety and quality of technical indicators, charting tools, and real-time price data. Platforms that offered customizable interactive charts, trend analysis, and multiple timeframes received better ratings.
- Stock Screener & Free Filters (15%): A strong stock screener is crucial for research, so we rated platforms based on the number and depth of filtering options. Higher scores were given to platforms that allowed customized searches using fundamental, technical, and sector-based criteria.
- Portfolio Tracking & Alerts (15%): We reviewed the ability to track multiple portfolios, set up watchlists, and receive alerts on stock movements. Platforms offering real-time updates, dividend tracking, and personalized notifications ranked higher.
- Ease of Use & User Experience (15%): Platforms were rated on their design, navigation, and accessibility across devices. Those with intuitive layouts, easy-to-read data, and smooth user experiences received better scores.
- Additional Perks & Limitations (5%): We considered unique tools, premium research access, and potential feature restrictions. Platforms with added perks like AI analysis or fewer paywalls scored higher, while those with aggressive ads or major limitations were rated lower.
- Community & Social Features (5%): Platforms with investor discussion forums, sentiment tracking, or social trading features were rated higher. Those lacking community-driven insights or engagement tools scored lower.
