The Seeking Alpha Stock Screener allows investors to discover stocks based on performance, value, dividends, and momentum.
Whether you're using the free Basic plan or Premium, we’ll walk through the core screening features, show real filter combinations, and demonstrate how investors apply them to uncover investment ideas.
Plan | Annual Subscription | Promotion |
|---|---|---|
Seeking Alpha Premium | $299 ($24.90 / month)
No monthly subscription | $4.95 for 1 month |
Seeking Alpha Pro | $2,400 ($200 / month)
No monthly subscription | $99 for 1 month |
Seeking Alpha – Alpha Picks | $499 ($41.58 / month)
No monthly subscription | N/A |
Best Free Seeking Alpha Screener Features
Seeking Alpha’s Basic plan includes a simplified version of the stock screener focused on fundamentals.
It allows users to explore general criteria such as market cap, dividend yield, and sector, making it useful for basic investment research.
1. Dividend Screening
Free users can screen for stocks based on dividend yield and payout consistency, ideal for income-focused strategies.
Dividend Yield: Set a minimum yield percentage to filter for income-generating companies.
Dividend History Access: Evaluate dividend consistency by reviewing multi-year payout trends.
Stock Type Filter: Limit results to dividend-paying equities like REITs or utilities.
-
Dividend Screening - Example
A conservative investor looking for stable income screens for stocks with a dividend yield over 3% in the utility sector, helping highlight low-volatility, income-focused opportunities.
2. Sector and Market Cap Screening
Free users can filter stocks by sector and market capitalization to target specific industries or size categories.
Sector Filter: Focus on industries like Financials, Energy, or Tech.
Market Cap Ranges: Screen for small-cap growth or large-cap stability.
Geographic Region: Filter U.S.-listed companies for domestic exposure.
-
Sector and Market Cap Screening - Example

An investor targeting defensive sectors selects Healthcare and filters for mid- to large-cap stocks with stable earnings.
3. Value-Oriented Fundamentals
The free screener allows basic value filters based on common valuation ratios.
Price-to-Earnings (P/E) Ratio: Screen for undervalued companies with low earnings multiples.
Price-to-Book (P/B) Ratio: Identify stocks trading below book value.
Dividend Yield: Combine value metrics with dividend filters for conservative plays.
-
Value-Oriented Fundamentals Screening - Example
A user screens for S&P 500 stocks with P/E below 15 and dividend yield above 2% to find value-dividend hybrid investments.
4. Performance-Based Sorting
Users can sort and explore stocks based on recent market performance, although these aren’t chart-based indicators.
1-Year or 6-Month Return: Evaluate price trends over time.
Volatility Awareness: Spot stocks with steady or erratic past performance.
Quick Chart View: Click into historical price movement (via TradingView) for context.
-
Performance-Based Sorting - Example
A trend-following investor sorts consumer discretionary stocks by highest 6-month return to identify recent outperformers.
5. Earnings Data Screening
The free screener gives access to basic earnings data, helping users find stocks with strong earnings growth or consistent performance.
EPS Growth: Filter stocks based on positive earnings-per-share (EPS) growth over the last quarter or year.
Earnings Surprises: Screen for companies that consistently beat earnings expectations.
Upcoming Earnings Dates: Track stocks with upcoming earnings announcements, providing opportunities for pre-earnings volatility trades.
-
Earnings Data Screening - Example
An investor looking for growth stocks filters for:
- EPS Growth: Positive over the last 2 quarters
- Earnings Surprise: Yes
- Market Cap: Over $1B
This highlights stocks showing strong earnings growth, with potential for further outperformance.
Best Paid Seeking Alpha Screener Features
Seeking Alpha’s Premium and Pro plans unlock powerful stock screening tools tailored for serious investors.
These advanced features go beyond basic filters by offering proprietary ratings, expert-driven metrics, and smarter screening logic designed to identify high-potential opportunities based on real data.
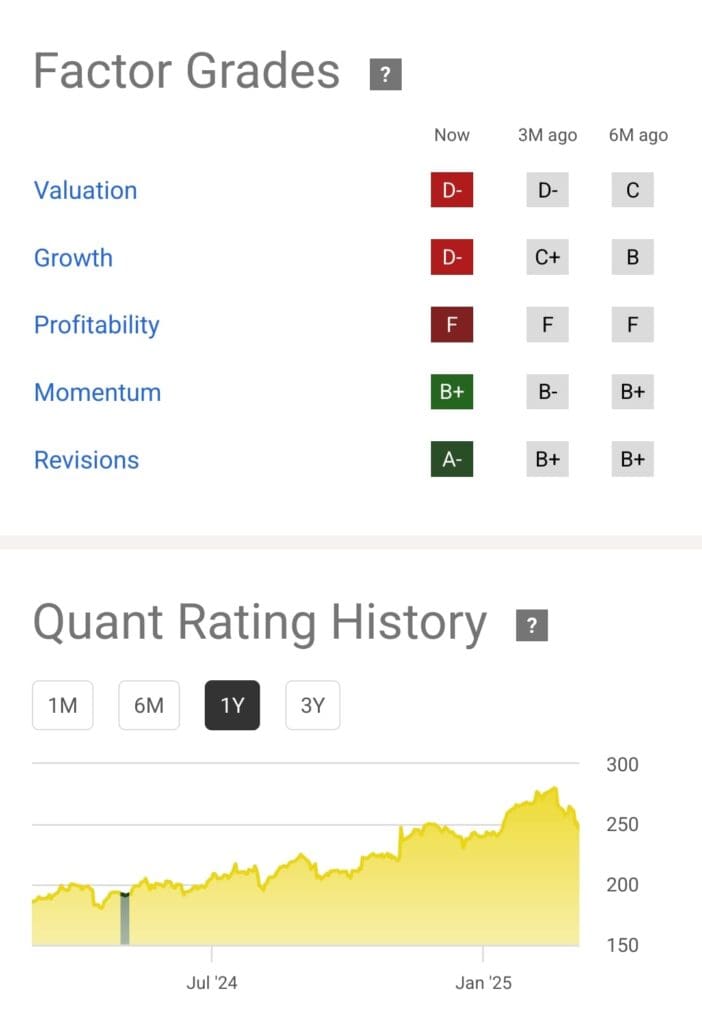
6. Quant Ratings Screener
Seeking Alpha’s Quant Ratings are algorithmic scores that evaluate stocks based on five core factors: valuation, growth, profitability, momentum, and earnings revisions.
Strong Buy Filter: Screen for stocks with a “Strong Buy” Quant Rating for potential outperformance.
Factor-Level Grades: Filter stocks with top grades in key areas such as growth or valuation.
Data-Driven Rankings: Identify candidates without relying on subjective analyst opinions.
-
Quant Ratings Screener – Example
An investor looking for high-momentum opportunities sets:
- Quant Rating: Strong Buy
- Momentum Grade: A or higher
- Sector: Technology
This returns fast-moving tech stocks with strong overall scores, ideal for those who look for stock recommendations.
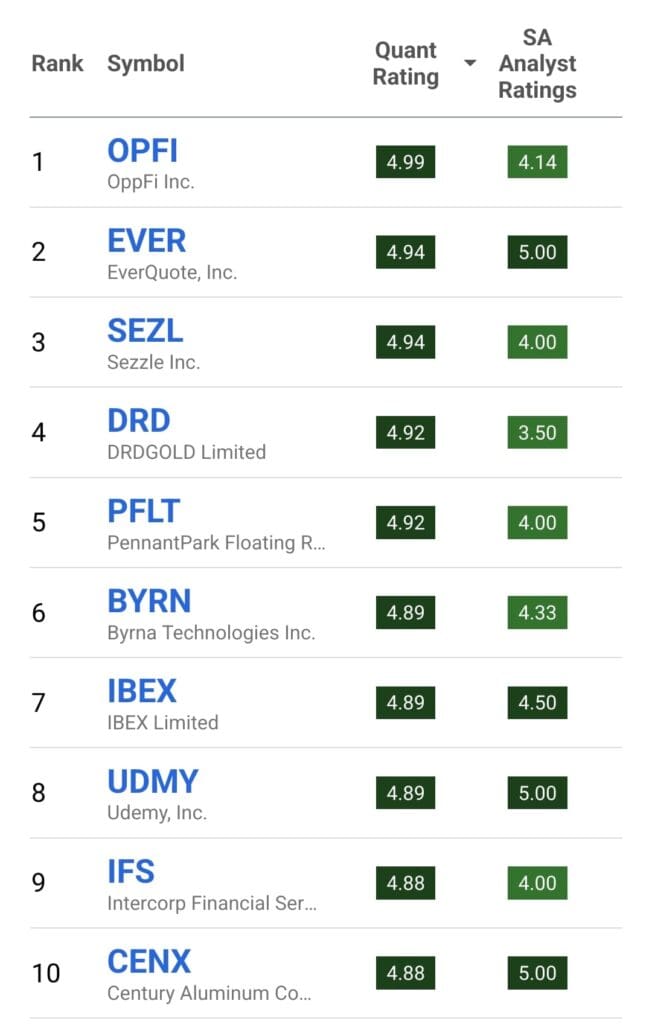
7. Top Stock Rankings Screener
Seeking Alpha curates top-performing stocks across different categories, helping users focus their screening on recommendations.
Top Growth Stocks: Stocks ranked based on rapid earnings and revenue expansion.
Top Dividend Stocks: Focus on companies with high yield and strong dividend safety scores.
Top Value Stocks: Find undervalued names with strong grades in valuation and profitability.

-
Top Stock Rankings Screener – Example
A dividend investor filters for:
- Top Dividend Stocks
- Dividend Safety Grade: A or higher
- Market Cap: Over $10B
This highlights reliable income stocks with proven payout stability and institutional appeal.
8. Institutional Ownership & Risk Filters
Seeking Alpha Premium includes institutional ownership data and risk warning tools to help align portfolios with smart money and avoid red flags.
Institutional Holdings Filter: Identify stocks with strong hedge fund or mutual fund support.
Risk Warnings: Flag companies with negative trends in earnings, valuation, or fundamentals.
Health Check Integration: Use portfolio health indicators to screen for safer investments.
-
Institutional & Risk Filter – Example
An investor seeking institutional-backed picks screens for:
- Institutional Ownership: Over 60%
- Dividend Safety: A
- Risk Flags: None
This helps surface well-supported companies with strong income stability and minimal risk concerns.
9. Factor Grades & Fundamental Screener
Premium users can filter stocks by granular factor grades tied to valuation, profitability, growth, and momentum.
Custom Grade Filters: Choose specific grades like “A+ in Growth” or “B+ in Profitability.”
Combined Screens: Apply multiple factor filters for balanced opportunities.
Financial Data Integration: Includes key ratios like P/E, debt-to-equity, and return on equity.
-
Factor Grade Screener – Example
A GARP (growth at a reasonable price) investor sets:
- Valuation Grade: A
- Growth Grade: A
- Market Cap: Mid-cap
This targets balanced stocks that offer both earnings momentum and reasonable pricing.
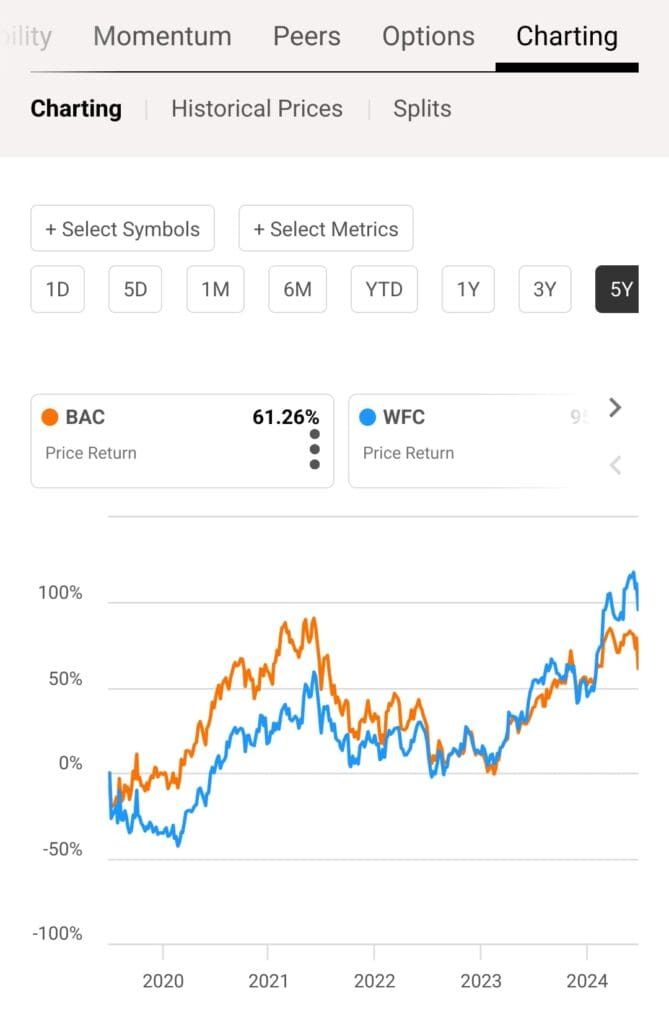
10. Side-by-Side Comparison Tool
While not a screener per se, this tool lets users compare up to six stocks across multiple metrics — ideal for narrowing shortlists.
Metric-by-Metric View: Compare valuation, growth, profitability, and EPS revision data.
Quant Rating Comparison: See how stocks stack up in the same industry.
Visual Layout: Identify leaders quickly using side-by-side analysis tables.
-
Comparison Tool – Example
An investor evaluating semiconductors compares Nvidia vs. AMD vs. Intel: looking at Profitability Grade, Forward P/E, and Analyst EPS revisions.
This makes it easier to see which company leads across strategic dimensions.
FAQ
No, all Seeking Alpha plans, including Pro, provide delayed stock prices. This may be sufficient for long-term investors but is not ideal for active traders needing real-time data.
No, Seeking Alpha is focused on stocks and ETFs. It does not include mutual fund or bond screening, unlike platforms like Morningstar or Zacks.
Yes, Seeking Alpha’s screener is accessible via desktop and mobile app, although the desktop version offers a more seamless experience with full filter options.
Premium users can save custom screens for future use. Free users can apply filters manually but do not have the option to save configurations.
The screener includes some non-U.S. listings but primarily focuses on U.S.-based equities and ADRs. International coverage is more limited than U.S. stocks.
Seeking Alpha allows portfolio syncing with some brokerages, enabling health checks and analysis, but the screener itself works separately from live brokerage data.
Yes, Premium users can filter ETFs by sector, performance, and Quant Ratings. The ETF screener is a part of the broader screening tool set.
Fundamental data and Quant Ratings are updated daily, but stock prices are delayed. This makes it more suitable for fundamental analysis than short-term trading.
