Stock Analysis (Free Plan)
Monthly Subscription
Promotion
Our Rating
Best For
- Overview
- Features
- Pros & Cons
Stock Analysis is a user-friendly stock research platform designed for investors and traders looking for detailed financial data, stock screeners, interactive charts, and market insights.
It offers a clean, intuitive interface that makes navigating financial reports, stock statistics, and historical performance easy.
Investors can access fundamentals, valuation metrics, analyst ratings, dividend history, earnings data, and technical indicators, all in one place.
The platform also includes ETF research, IPO tracking, market movers, and comparison tools, making it a well-rounded resource for those who prefer to analyze stocks themselves.
However, real-time stock prices, top analyst insights, and stock recommendations are locked behind the premium plan. Additionally, there’s no portfolio tracking, trading functionality, or real-time alerts, making it less useful for active traders.
- Stock screener
- ETF screener
- Stock analysis tools
- Technical charting
- Watchlist tracking
- IPO tracking
- Stock comparison
- Stock market news
- Earnings calendar
- Trending stocks
- ETF provider insights
- Financial statement analysis
- User-friendly interface
- Comprehensive stock screener
- Detailed financial data
- Strong ETF research
- Market news updates
- Customizable watchlists
- No portfolio tracking
- Lacks real-time data
- No stock recommendations
- Limited technical analysis
- Premium features paywalled
- No global stock coverage
How To Research Stocks With Stock Analysis?
Stock Analysis provides a powerful platform for investors to research stocks with detailed financial data, stock & ETF screeners, and valuation metrics.
-
Stock Screener
The Stock Analysis Stock Screener is a user-friendly and highly detailed tool designed for investors seeking free, in-depth stock insights.
It allows users to filter and analyze stocks based on over 250+ financial, valuation, performance, and technical indicators.
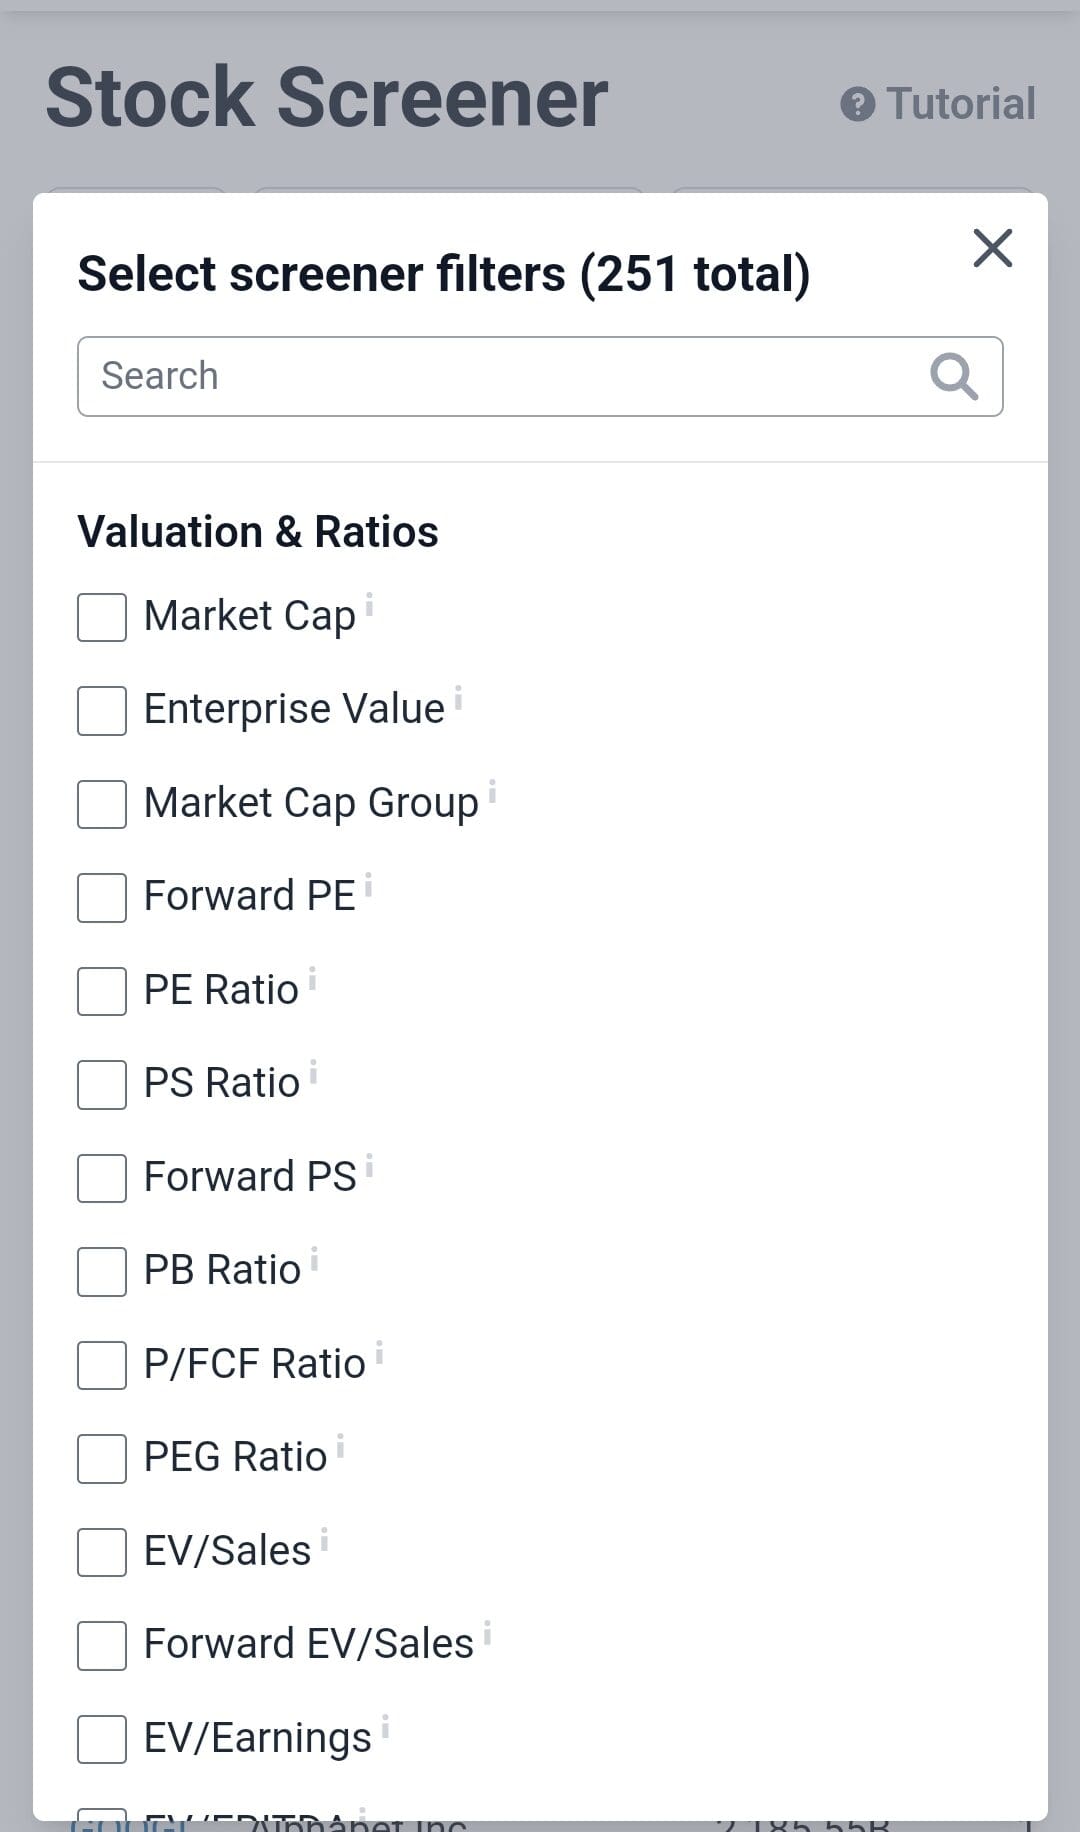
Investors can customize tables with key metrics like market cap, analyst ratings, stock price, price target upside, dividend yield, revenue growth, PE ratio, and historical performance across different time frames.
The screener also includes advanced earnings, financials, and fundamental analysis metrics, making it useful for traders and long-term investors alike.

However, some advanced filters—such as top analyst ratings, price targets, and deeper research tools—are only available in the pro version.
-
ETF Screener
The Stock Analysis ETF Screener is an intuitive, data-rich tool for filtering and analyzing exchange-traded funds (ETFs).

It offers a comprehensive set of over 90+ indicators covering asset class, assets under management (AUM), stock price, volume, expense ratio, issuer, index, and PE ratio.
The screener also includes dividend data (yield, payout ratio, growth, and ex-dividend dates), technical indicators like RSI and moving averages, and fundamental valuation metrics.

Users can quickly filter ETFs by category, leverage, options availability, and geographic exposure, making it easy to find funds that align with their investment strategy.
-
Stock Analysis
Those who want to research specific stocks will get clean, well-structured interface for researching stocks with detailed financial data, historical performance, and forecasts.

The platform includes key sections such as financials, statistics, dividends, and more, offering a comprehensive view of a stock’s performance and valuation.
Investors can analyze fundamentals through financial statements, key metrics, and earnings forecasts.
Here's an example of a stock analyst consensus chart and targets:

The News section aggregates relevant market updates, helping investors stay informed about recent developments.
However, some advanced features—such as premium analyst insights or deeper historical data restricted to the pro version.
How To Analyze Stocks With Stock Analysis?
Stock Analysis offers in-depth tools for analyzing fundamentals & technical charts, comparing assets, and tracking your watchlist:
-
Charting & Technical Analysis
The Stock Analysis platform offers a powerful interactive charting tool with flexible time intervals, drawing tools, and comparison features.
Users can customize charts with multiple technical indicators, including averages/bands, momentum/oscillators, Money flow, dupport/resistance, trend analysis, and volatility metrics.

Investors can save chart views for future reference, making it convenient for tracking stock trends. The ability to overlay multiple stocks for direct comparison enhances strategic analysis.
Some premium features, such as earnings and dividend event markers and export to pdf or excel are locked behind the pro version.
-
Watchlist
The Watchlist allows users to track stocks and ETFs, similar to portfolio tracking.
With the ability to add text notes, track shares owned, target prices, and profit/loss performance, the Watchlist serves as a comprehensive stock tracking solution for both short-term traders and long-term investors.

The customizable table layout enables users to view key financial metrics such as PE ratio, debt-to-equity, revenue growth, and free cash flow.
Additionally, users can track fundamental indicators like return on equity, book value per share, and cash flow trends.
However, the Watchlist lacks portfolio analysis, recommendations, and deeper insights into asset allocation.
-
IPO Section
The Stock Analysis IPO section provides a comprehensive hub for tracking new public offerings.
Investors can explore Recent IPOs, an IPO calendar with upcoming listings, and IPO statistics to analyze trends in initial public offerings.

The IPO screener allows users to filter offerings based on market cap, sector, pricing, and performance, making it easier to find investment opportunities.
Additionally, the IPO news section keeps investors updated with market-moving announcements and insights on new listings.
-
Compare ETFs & Stocks Side By Side
The comparison tool allows investors to analyze stocks and ETFs side by side, providing a clear comparison of key financial, performance, and valuation metrics.
Users can compare market cap, stock price, PE ratio, dividend yield, revenue growth, historical returns, and technical indicators for a more informed decision-making process.

The comparison tool supports customized views, saving comparisons for later reference, and visualizing data through interactive charts.
With a clean layout and extensive data points, it simplifies investment research for those looking to differentiate between individual stocks and broader ETF holdings.
-
Stock Market News
The Stock Market News section on Stock Analysis provides timely updates on market trends, earnings reports, economic events, and stock movements.
It covers a range of topics, including company-specific news, macroeconomic developments, and sector performance, helping investors stay informed.

The news feed is well-organized and frequently updated, ensuring users get relevant market insights.
Additionally, news articles are often linked to stock-specific pages, allowing for quick navigation between company data and recent developments.
Additional Features & Tools
Stock Analysis offers a range of additional tools to help investors track markets, monitor stocks, and stay informed:
- Market Newsletter: A regular newsletter that delivers market updates, stock insights, and key financial news directly to users, helping them stay informed without constant monitoring.
- Trending Today: Highlights the most discussed and researched stocks of the day, making it easy to spot market trends and investor sentiment.
- ETF Providers: Lists major ETF issuers and providers, offering insights into their fund offerings, expense ratios, and investment strategies.
- 100 Newest ETFs: A dedicated section showcasing the latest ETFs introduced to the market, helping investors find new opportunities and trends.
- Stock Lists: Curated stock lists based on different criteria, such as high-growth stocks, dividend payers, and value stocks, making stock discovery easier.
- Earnings Calendar: Displays upcoming earnings reports, including release dates, analyst expectations, and earnings trends for publicly traded companies.
- Easy Menu Navigation: The platform's intuitive layout ensures seamless navigation between stock research, screeners, news, and comparison tools.
Stock Analysis: What’s Missing?
While Stock Analysis offers a clean and data-driven platform, it has certain gaps compared to its competitors and its own premium version:
-
No Portfolio Analysis or Advanced Tracking Features
Stock Analysis does not offer portfolio tracking, asset allocation insights, or performance benchmarking. While users can build a watchlist, there is no tool to analyze risk exposure, diversification, or sector allocation.
Many investors, especially long-term ones, rely on portfolio-level insights to adjust their holdings and assess risk vs. return.
-
No Real-Time or Intraday Data
For active traders, the absence of real-time stock quotes, intraday price movements, and Level 2 market data is a major limitation.
Stock Analysis primarily focuses on historical performance and fundamental analysis, making it less useful for day traders or those who rely on short-term technical signals.
-
No Expert Stock Picks or Recommendations
Stock Analysis ia not an expert stock picks app and doesn't provide buy/sell recommendations or proprietary scoring systems.
Competitors often include curated investment ideas, AI-generated stock ratings, or analyst-backed buy/sell signals, making it easier for investors to make decisions.
-
No Access to Top Stocks & Best Wall Street Analysts
A major limitation is the lack of access to the Top 50 “Strong Buy” Stocks and the Top Wall Street Analysts ranking in the free version.
These lists provide expert-backed insights into high-conviction stock picks and rank analysts based on their historical accuracy.
Ideal Users: Who Should Try Stock Analysis?
Here are the types of investors and traders who may find it useful:
- Beginners: The clean interface and easy navigation make it a great starting point for new investors who want an advanced free research tool to explore stocks, ETFs, and financial data without information overload.
- Long-Term Investors: Ideal for those who focus on fundamentals, financials, and historical performance to evaluate stocks for long-term growth or dividend income.
- DIY Researchers: Great for investors who prefer to analyze data themselves rather than rely on stock picks, as the platform provides detailed financials and valuation metrics.
- ETF Investors: The ETF screener and provider insights make it useful for those looking to compare funds based on expense ratios, performance, and holdings.
Who Might Find Stock Analysis Lacking?
While Stock Analysis offers plenty of useful tools, it may not suit everyone. Below are types of investors or traders who might find the platform lacking:
- Investors Looking for Stock Recommendations: Stock Analysis does not provide expert stock picks, buy/sell signals, or curated recommendations, which are crucial for those who rely on external advice.
- Advanced Traders: If you're looking for tools like backtesting, advanced charting features, or multi-strategy comparisons, you may find Stock Analysis too basic.
- Portfolio Managers: Investors who need tools for portfolio tracking, risk analysis, and asset allocation will find Stock Analysis limited, as it lacks these features.
- Global Investors: The news and data offered are more U.S.-focused, so international investors looking for global market insights may find Stock Analysis too narrow.
Stock Analysis Free vs Pro: Worth To Upgrade?
Stock Analysis offers a free plan with basic stock data, financials, and earnings reports, but upgrading to Stock Analysis Pro unlocks advanced research tools, deeper fundamental metrics, and enhanced stock screening options.
Plan | Subscription | Promotion |
|---|---|---|
Stock Analysis Pro | $9.99
$79 ($6.58 / month) if paid annually | 60-day money back guarantee |
If you're a casual investor, the free plan may be sufficient.
If you need better screening tools, financial comparisons, and stock insights, upgrading to Stock Analysis Pro could be worth it.
FAQ
No, Stock Analysis does not offer real-time stock prices. The platform provides delayed market data, making it less suitable for active traders who need instant price updates.
Basic options-related data, such as whether a stock has options available, is included, but detailed options chains, Greeks, and implied volatility analysis are not available.
Yes, users can download charts and data to PDF or Excel, but it requires a premium subscription.
While it covers U.S. and some international stocks, the platform is primarily focused on U.S. equities. ETF data includes international funds, but global stock coverage is limited.
No, Stock Analysis does not provide real-time stock alerts, price notifications, or breaking news alerts, unlike platforms like Seeking Alpha or TradingView.
No, Stock Analysis does not currently offer a mobile app. The platform is accessible via mobile browsers, but there is no dedicated app for iOS or Android.
No, Stock Analysis does not offer a discussion forum or community like Seeking Alpha or Reddit’s investing groups. It focuses purely on data-driven research.
No, insider trading data is not available. Investors looking for insider buying/selling activity may need to use Finviz, MarketBeat, or Yahoo Finance.
No, the platform is focused solely on stocks and ETFs. Investors looking for bonds, forex, or cryptocurrency data will need to use other platforms.
While it offers technical indicators and interactive charts, it lacks real-time data, Level 2 market depth, and intraday trading tools, making it less ideal for day traders.
Review Free Stock Analysis Tools


Investment Analysis & Research Tools : Review Methodology
At The Smart Investor, we evaluated free investment research platforms based on the quality and depth of their features compared to other free alternatives. Each platform was rated based on the following criteria:
- Fundamental Analysis Tools (25%): We assessed the availability of key financial data, including income statements, balance sheets, cash flow, valuation metrics, and analyst estimates. Platforms with more in-depth historical data, forward-looking projections, and research reports scored higher.
- Technical Analysis Features (20%): We examined the variety and quality of technical indicators, charting tools, and real-time price data. Platforms that offered customizable interactive charts, trend analysis, and multiple timeframes received better ratings.
- Stock Screener & Free Filters (15%): A strong stock screener is crucial for research, so we rated platforms based on the number and depth of filtering options. Higher scores were given to platforms that allowed customized searches using fundamental, technical, and sector-based criteria.
- Portfolio Tracking & Alerts (15%): We reviewed the ability to track multiple portfolios, set up watchlists, and receive alerts on stock movements. Platforms offering real-time updates, dividend tracking, and personalized notifications ranked higher.
- Ease of Use & User Experience (15%): Platforms were rated on their design, navigation, and accessibility across devices. Those with intuitive layouts, easy-to-read data, and smooth user experiences received better scores.
- Additional Perks & Limitations (5%): We considered unique tools, premium research access, and potential feature restrictions. Platforms with added perks like AI analysis or fewer paywalls scored higher, while those with aggressive ads or major limitations were rated lower.
- Community & Social Features (5%): Platforms with investor discussion forums, sentiment tracking, or social trading features were rated higher. Those lacking community-driven insights or engagement tools scored lower.
