Table Of Content
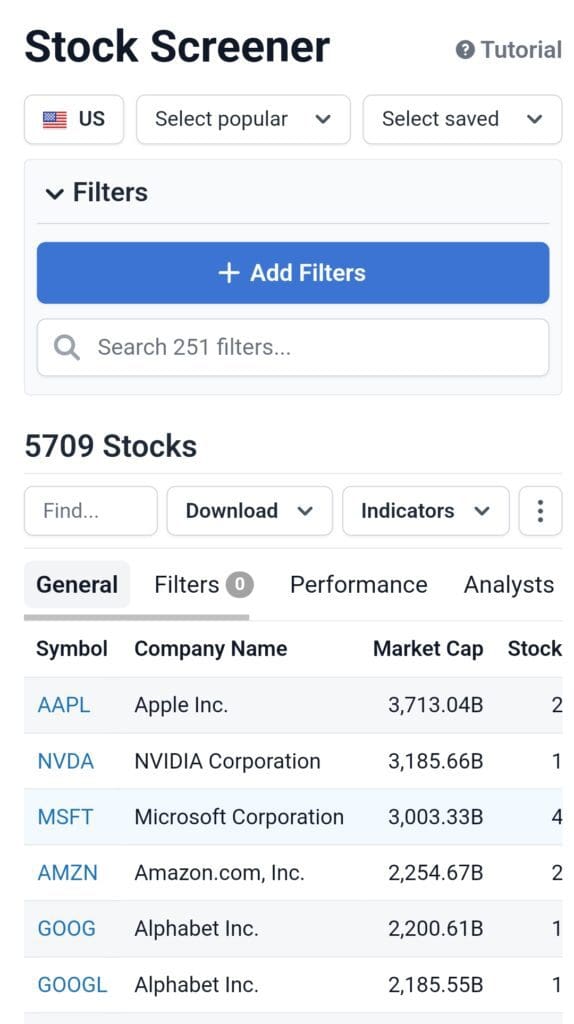
The Stock Analysis Stock Screener is a versatile tool that allows investors to filter and find stocks based on a variety of criteria such as market cap, sector, performance, and valuation metrics.
It’s designed to help investors identify opportunities that meet their investment goals, whether they are looking for growth, income, or undervalued stocks.
Plan | Annual Subscription | Promotion |
|---|---|---|
Stock Analysis Pro | $79 ($6.58 / month) | 60-day money back guarantee |
How To Use Stock Analysis Free Screener Features
The Stock Analysis Stock Screener provides a range of free features that help investors filter stocks based on their preferred criteria.
These features help users discover investment opportunities without needing a premium subscription.
1. Earnings and Revenue Growth Screening
Stock Analysis offers a powerful filter to help investors identify companies with strong earnings and revenue growth potential.
This feature is ideal for investors looking for companies that demonstrate solid financial performance and consistent upward trends in key metrics.
Earnings Growth: Filter stocks based on positive earnings growth over the past few quarters or years.
Revenue Growth: Focus on companies showing consistent revenue growth, which may indicate strong business fundamentals.
Earnings Per Share (EPS): Target stocks with improving EPS, as it reflects profitability and potential for future gains.
-
How To Use Earnings and Revenue Growth Screening - Example
An investor interested in growth stocks could apply the following filters:
Earnings Growth: Positive in the last 4 quarters
Revenue Growth: Over 5% year-over-year
EPS: Positive and increasing
This filter helps investors focus on companies with consistent earnings and revenue growth, which are typically strong candidates for long-term investments.
2. Financial Strength Screening
Financial strength is a key indicator for investors who prioritize risk management and stability. Stock Analysis includes filters that help identify financially strong companies with healthy balance sheets and low debt.
Debt-to-Equity Ratio: Screen for stocks with low debt-to-equity ratios, indicating strong financial leverage.
Free Cash Flow: Focus on companies with positive free cash flow, as this shows the ability to generate cash after expenses.
Return on Equity (ROE): Use ROE to find companies efficiently generating profit with shareholder equity.
-
How To Use Financial Strength Screening - Example
A risk-averse investor might set the following filters:
Debt-to-Equity: Less than 0.5
Free Cash Flow: Positive
ROE: Over 10%
This approach helps identify financially healthy companies with solid cash flow, making them attractive to investors focused on minimizing risk.
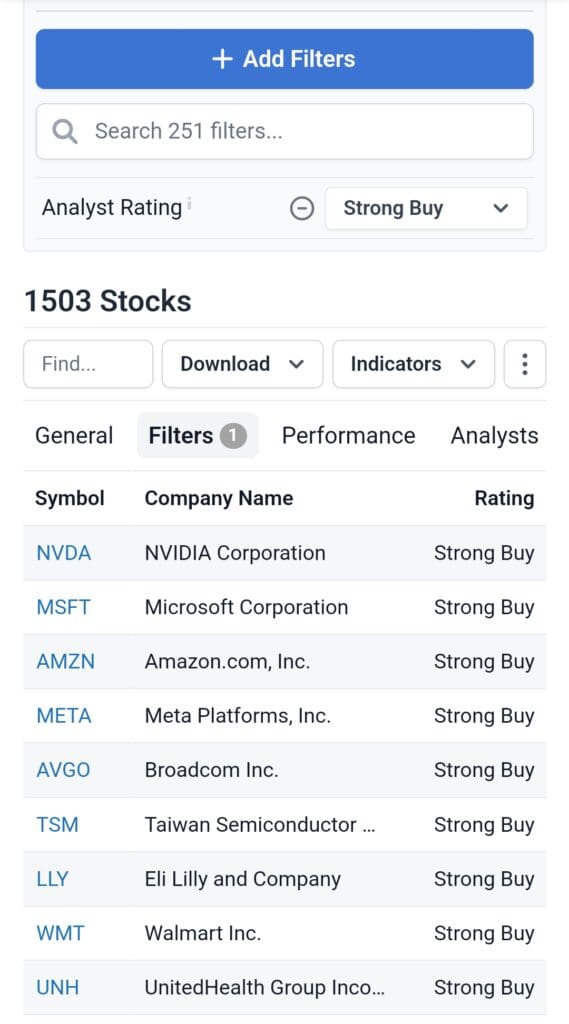
3. Analyst Ratings & Sentiment
Stock Analysis offers a range of filters to assess market sentiment by using analyst ratings, price targets, and consensus estimates. This feature allows investors to evaluate stock sentiment based on expert opinions and compare stock projections.
Analyst Rating: Filter stocks based on analyst ratings, such as Buy, Hold, or Sell.
Top Analyst Count: Identify stocks with multiple top-rated analysts recommending them.
Top Analyst Price Target: Screen for stocks with the highest price targets from analysts.
Top Analyst PT Upside (%): Focus on stocks with significant upside potential based on analyst price targets.
-
How To Use - Example
An investor wants to find growth stocks with strong analyst backing. They apply the following filters:
Analyst Rating: Buy
Top Analyst PT Upside: 20%+
Top Analyst Count: Over 5 analysts
This approach helps uncover stocks with strong analyst consensus and potential for price appreciation.
5. Valuation and Profitability Ratios
Stock Analysis enables investors to assess a stock’s valuation and profitability by using various financial ratios, which are key to evaluating whether a stock is undervalued or overvalued.
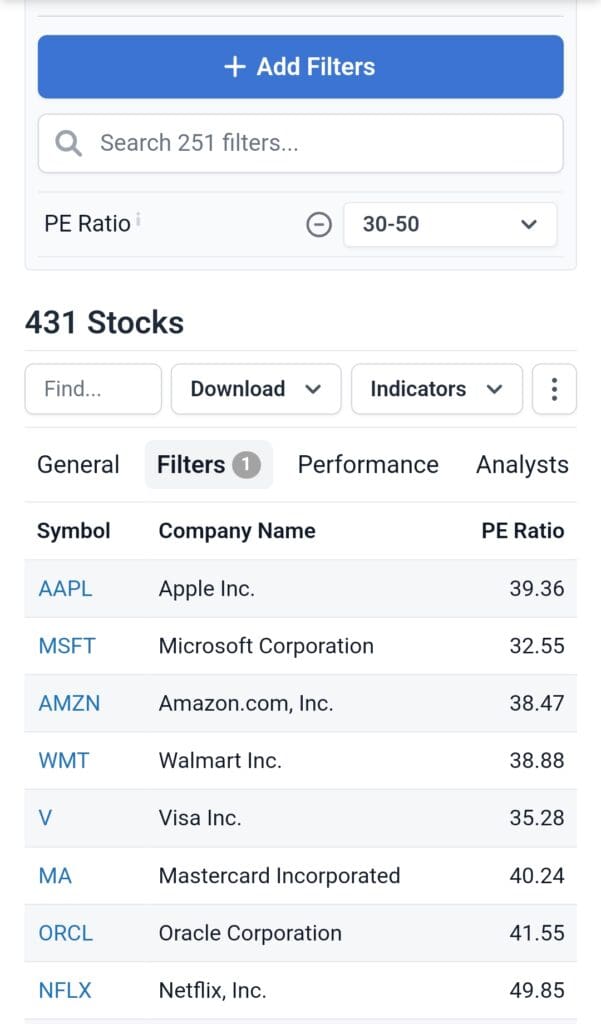
P/E Ratio: Filter stocks based on price-to-earnings ratio, helping identify overvalued or undervalued stocks.
PEG Ratio: Use the price-to-earnings growth ratio to find stocks that are undervalued in relation to their growth potential.
Return on Equity (ROE): Focus on companies with strong returns on equity, indicating efficient use of shareholder capital.
Operating Margin: Screen for companies with healthy operating margins, suggesting efficient operations.
-
Valuation and Profitability Ratios - Example
A value investor looking for undervalued stocks with solid profitability might set the following filters:
P/E Ratio: Under 15
PEG Ratio: Under 1.5
Return on Equity (ROE): Over 15%
This strategy identifies stocks that are potentially undervalued based on their earnings growth and strong profitability.
6. Technical Analysis Filters
For traders who rely on technical indicators to guide their investment decisions, Stock Analysis offers a set of filters based on technical performance.
Relative Strength Index (RSI): Filter for stocks that are either overbought or oversold based on RSI, helping to identify potential entry or exit points.
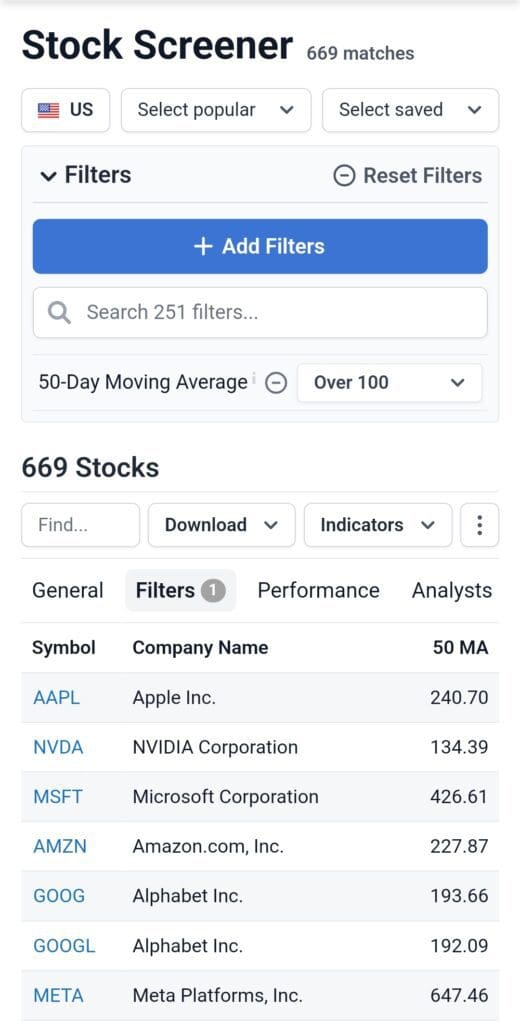
Moving Averages: Screen for stocks that are trending above or below key moving averages (e.g., 50-day or 200-day moving averages), which can signal bullish or bearish trends.
Beta (5Y): Look for stocks with high or low beta values, which can indicate a stock's volatility compared to the broader market.
-
How To Use Technical Analysis Filters - Example
A technical trader looking for potentially oversold stocks might apply the following filters:
RSI: Under 30 (oversold)
50-Day Moving Average: Stock price above 50-day moving average
Beta (5Y): Over 1.5 (high volatility)
This strategy helps identify stocks with bullish potential after a period of low momentum or volatility.
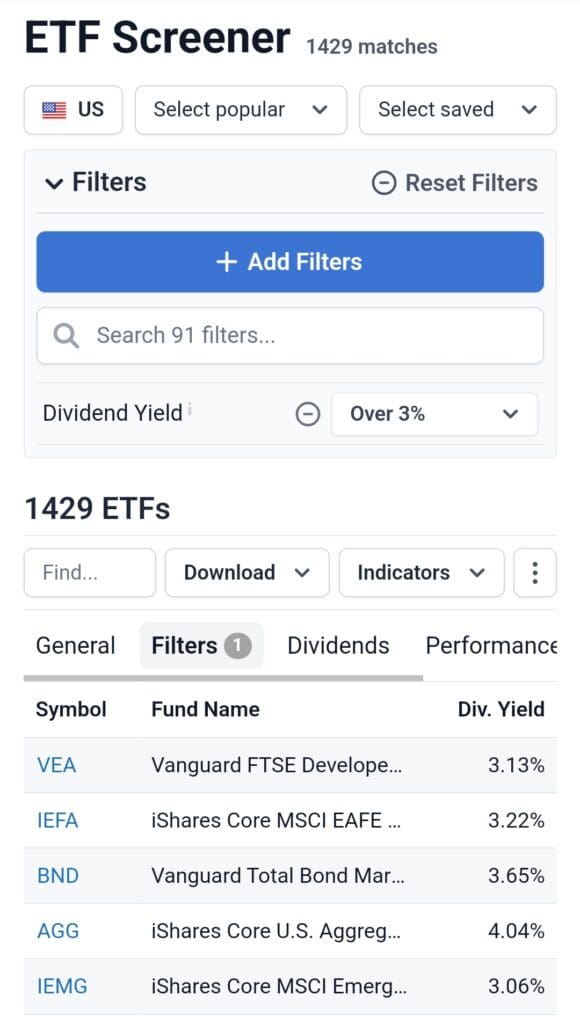
7. Dividend & Yield Analysis
Stock Analysis allows users to filter stocks based on their dividend characteristics, making it ideal for income-focused investors who prioritize steady dividend returns.
Dividend Yield: Filter stocks based on their dividend yield to identify companies offering attractive income potential.
Dividend Growth: Look for companies with consistent and growing dividend payouts over time.
Payout Ratio: Screen for stocks with a sustainable payout ratio, which is key to assessing whether a company can continue to pay dividends during tough times.
-
Dividend & Yield Analysis - Example
A retiree looking for dependable dividend income might apply the following filters:
Dividend Yield: 4%+
Dividend Growth: Positive over 5 years
Payout Ratio: Less than 60%
This combination helps identify stocks with strong and sustainable dividend payouts that align with income-focused strategies.
Best Paid Stock Analysis Screener Features
The Stock Analysis Stock Screener allows users to filter stocks based on various criteria, helping investors find opportunities that meet their investment goals.
Key features include customizable filters and real-time data updates.
8. Comprehensive Stock & ETF Screening
Stock Analysis Pro allows users to filter and analyze stocks and ETFs with over 200+ indicators, providing detailed insights into financial performance, valuation, and technical indicators.
Users can screen ETFs based on their investment strategy, whether looking for growth, value, income, or momentum stocks.
Stock & ETF Filters: Customize your search based on a wide range of criteria, including market cap, sector, PE ratio, dividend yield, and more.
Advanced Performance Metrics: Filter by metrics like total return, CAGR, revenue growth, and EPS growth over different time frames.
9. Enhanced Analyst Ratings & Price Targets
Pro users have access to advanced analyst ratings and price target filters, which help identify stocks with strong analyst backing and significant upside potential.
Analyst Rating Filters: Find stocks with “Buy” or “Strong Buy” ratings from top analysts, ensuring you're following expert recommendations.
Price Target Upside: Screen for stocks with substantial upside based on analyst price targets, indicating growth potential.
Top Analyst Insights: Filter by the top-performing analysts only, ensuring you're relying on the most accurate recommendations.
10. Unlimited Exports & Saved Stock Screeners
Stock Analysis Pro allows users to save stock screeners and export data to Excel or CSV, making it easy to continue research offline and track changes over time.
Save Custom Screeners: Create and save custom filters for future use, making it easier to replicate research strategies.
Export Data: Download stock data, watchlist performance, or portfolio information to Excel or CSV files for offline analysis.
FAQ
Stock Analysis is ideal for long-term investors, self-directed researchers, and income-focused investors who need access to detailed financial data, stock screeners, and performance metrics. Its easy-to-use platform makes it accessible to beginners while providing advanced tools for experienced investors.
Stock Analysis allows users to filter stocks based on dividend yield, payout ratios, and dividend growth, which is particularly helpful for income-focused investors looking for stocks that provide stable and growing dividend payments over time.
Stock Analysis primarily focuses on U.S.-based stocks, and its data and market news are mainly centered around the U.S. market. Investors looking for international stock coverage may find the platform's offerings limited for global markets.
While Stock Analysis provides some technical charting tools, including basic indicators like moving averages, it is more focused on fundamental analysis. For advanced technical analysis, users may need to explore other platforms with more specialized charting capabilities.
Currently, Stock Analysis does not offer a dedicated mobile app. However, the platform is fully responsive and can be accessed through mobile browsers, allowing users to perform stock screenings and access data on the go.
The free version of Stock Analysis offers access to essential features like customizable filters and basic financial data, but it lacks advanced tools such as analyst ratings, institutional activity tracking, and more detailed historical data. For those requiring deeper insights, the premium plan is recommended.
