Table Of Content
Where to Find Stock Analyst Ratings
Stock analyst ratings are widely available across major finance platforms and brokerage tools. Here's where investors can reliably find them:
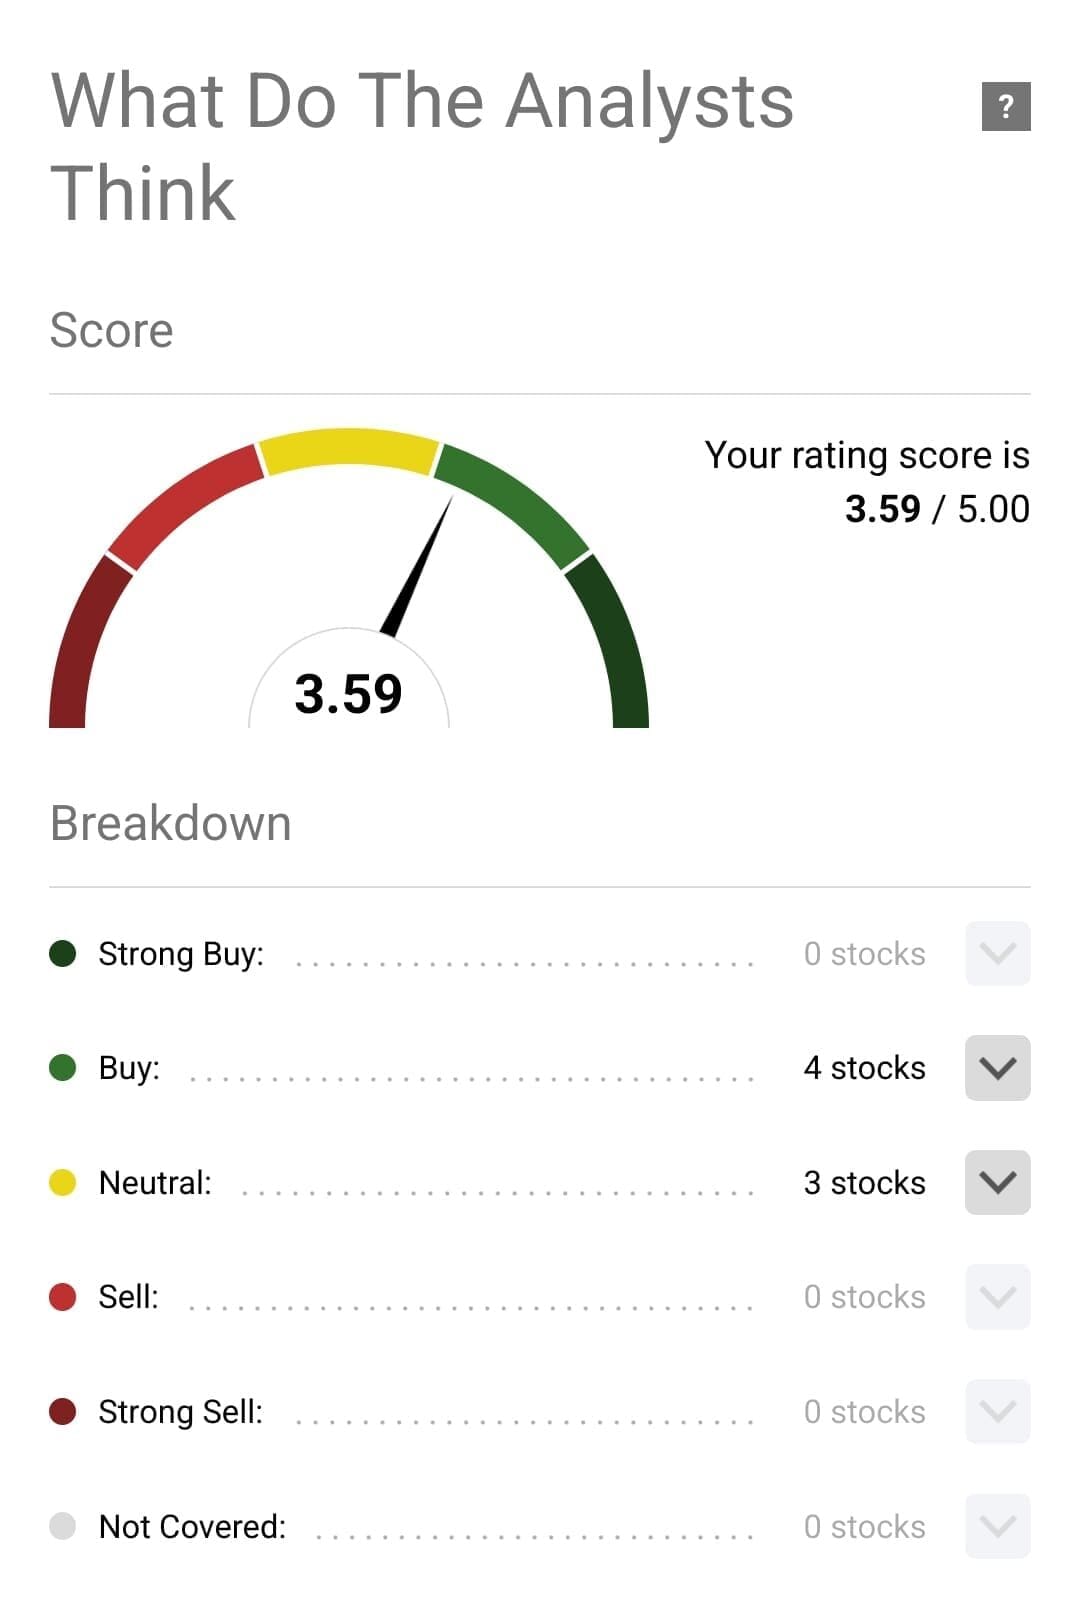
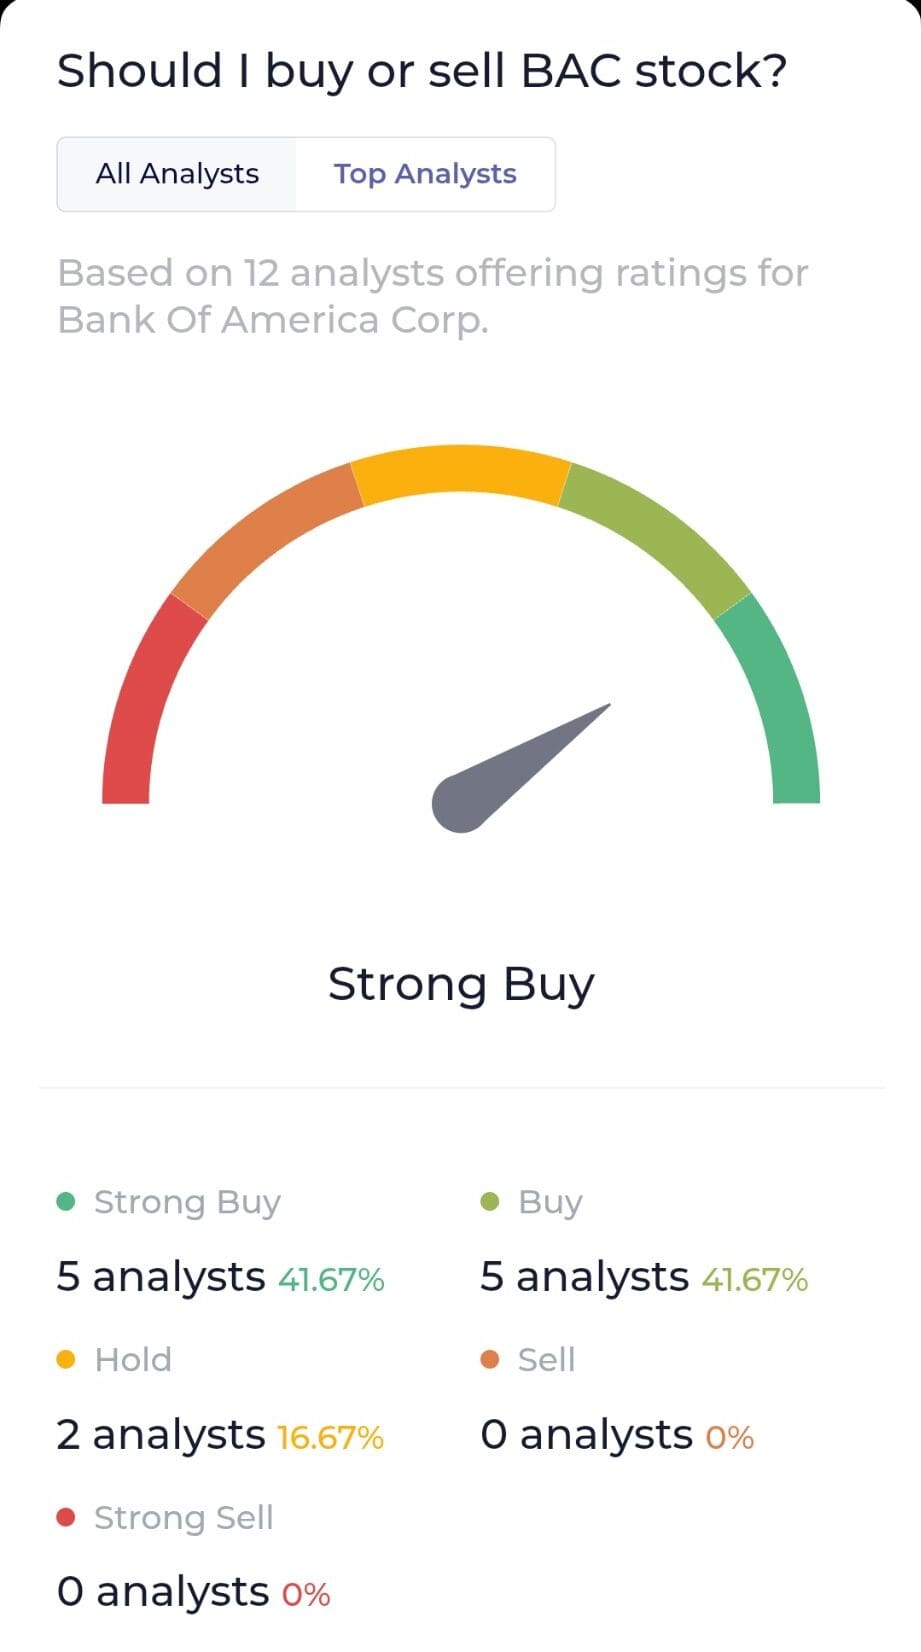
Yahoo Finance: Offers analyst consensus ratings with a breakdown of strong buy, buy, hold, and sell opinions.
Morningstar, Zacks and TipRanks: Known for research-driven ratings and long-term outlooks based on fundamentals.
Brokerage platforms: Many, like Fidelity or Robinhood, provide analyst summaries from firms like CFRA or TipRanks.
Financial media and tools: Bloomberg and Seeking Alpha include analyst commentary with context and target prices.
For example, searching Apple (AAPL) on Yahoo Finance shows its average analyst rating (e.g., “Buy”) with price targets and contributor analysis. Investors use this information to compare sentiment across sources.
Plan | Subscription | Best For |
|---|---|---|
Morningstar Investor | $34.95
$249 ($20.75 / month) if paid annually | Retirement Planners |
Zacks Premium | $249 ($20.75/month)
No monthly plan | Research-Driven Investors |
Motley Fool Stock Advisor | $199 (16.60 / month)
No monthly plan
| Stock Picks |
Yahoo Finance Gold | $49.95
$479.40 ($39.95 / month) if paid annually | Casual Investors |
InvestingPro | $15.99
$120 ($9.99 / month)
if paid annually | Global Market Investors |
TipRanks Premium | $359 ($30 / month)
No monthly plan | Analysts Followers |
Seeking Alpha Premium | $299 ($24.90 / month)
No monthly subscription | Research-Oriented Investors |
How to Interpret Buy, Hold, and Sell Ratings
Let's start with the basics: understanding what “buy,” “hold,” or “sell” means can help investors make better-informed decisions—not just follow the crowd.
-
Buy Rating
A “buy” or “strong buy” suggests analysts expect the stock to outperform its sector or index.
For instance, if Nvidia receives a “strong buy” due to its AI growth, investors might see it as a signal to initiate or add to their position.
These ratings often include a price target that’s above current levels, which helps investors estimate potential upside.

-
Hold Rating
A “hold” doesn’t mean “do nothing”—it often signals uncertainty or a fully valued stock.
For example, if Coca-Cola is rated “hold,” it might be because its growth potential is already priced in.
Therefore, analysts suggest maintaining your position but waiting for a better entry point or clearer outlook. Some investors treat “hold” as a caution flag rather than a neutral view.
-
Sell Rating:
A “sell” rating indicates analysts believe the stock is likely to underperform due to deteriorating fundamentals or overvaluation.
Fot example, if Zoom receives a downgrade to “sell” after weak guidance, it signals risk even if the price hasn’t dropped yet.
As a result, some investors use it to exit positions before potential losses deepen. However, few stocks receive sell ratings compared to buys, so this label tends to carry weight.
Analyst Ratings: Additional Key Definitions
Stock analyst ratings often come with extra terms that add useful context. Here are key definitions to understand what analysts really mean:
Target Price: This is the expected price level for a stock over a set time—usually 12 months. For instance, if Microsoft’s current price is $300 and the target is $350, analysts expect upside.
Consensus Rating: This summarizes all analyst opinions into one average label, such as “Moderate Buy.” It reflects market-wide sentiment rather than a single firm’s view.
Earnings Estimate: Analysts forecast a company’s earnings per share (EPS) for upcoming quarters. For example, a bullish forecast might lead to upgrades.
Revisions Trend: If multiple analysts raise or lower estimates ahead of earnings, it may indicate improving or weakening expectations.
These terms are crucial for understanding what’s driving the rating behind the scenes.

How to Evaluate Analyst Credibility and Accuracy
Not all analyst ratings carry the same weight—credibility depends on the firm, methodology, and track record. Investors should look beyond the label to evaluate them.
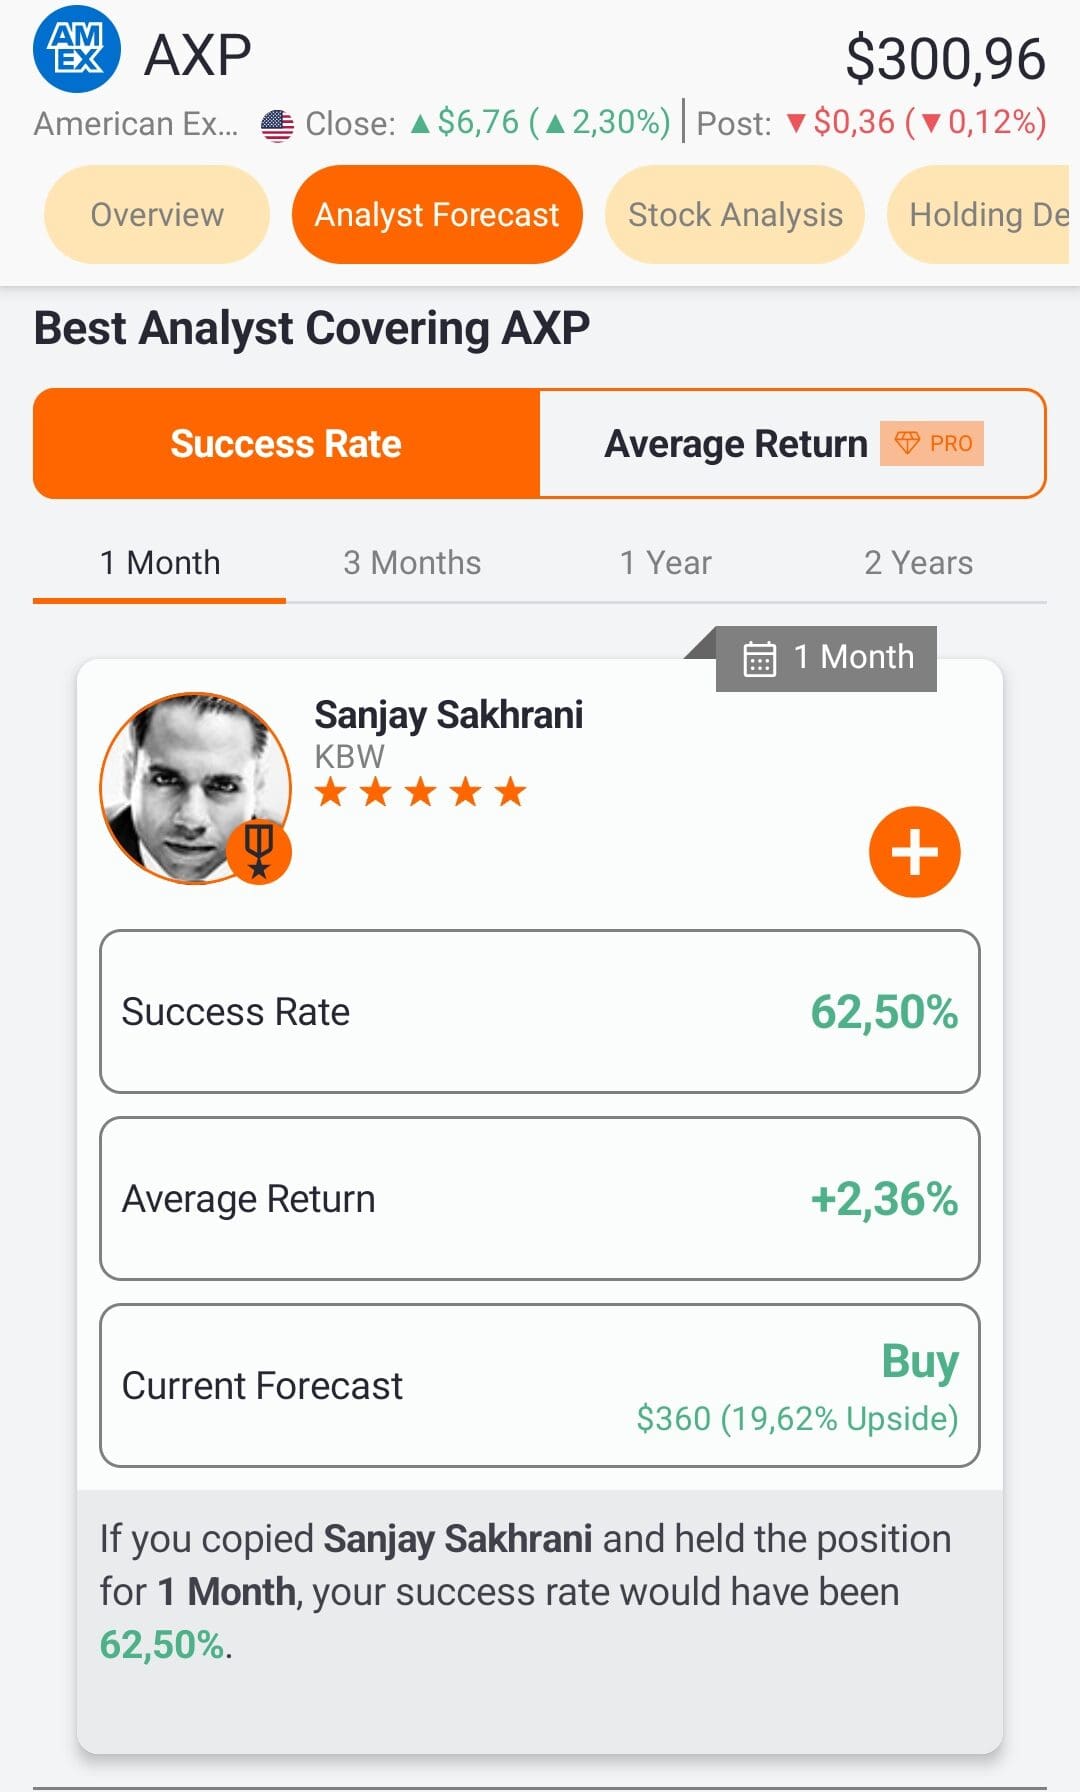
Start by checking the analyst's historical accuracy. Platforms like TipRanks show how past recommendations performed, which helps identify consistently accurate analysts.
For example, if one analyst's “buy” calls on tech stocks have historically led to 20% gains, their rating may be more reliable than a less-tested peer.

Also, considering the firm’s reputation, Goldman Sachs or JP Morgan tend to have more influence than lesser-known firms. However, even respected firms can miss big shifts, especially during volatile markets.
Therefore, use analyst ratings as one input—not a final decision. Combine them with your research, earnings reports, and technical analysis. As a result, you’ll avoid overreliance on potentially biased or outdated opinions.
How Analyst Upgrades and Downgrades Affect Stock Prices
Analyst upgrades and downgrades can cause immediate price reactions—especially when issued by well-known firms.
For example, if Goldman Sachs upgrades a stock from “hold” to “buy,” investors may rush in, pushing the price up quickly.
Conversely, a downgrade after earnings—such as Netflix being cut to “sell” due to slowing subscriber growth—can trigger sharp declines.
These reactions occur because institutional investors often act on new analyst opinions to rebalance portfolios, making short-term volatility common.

Should You Trust Analyst Ratings?
Analyst ratings offer helpful insights, but they shouldn't be followed blindly. They’re often influenced by market sentiment, firm relationships, or access to company executives.
Also, analysts often issue more “buy” than “sell” ratings—creating a potential bias. Accordingly, many stocks are rated “buy” or “hold,” even in weak sectors. Therefore, it’s critical to evaluate the reasoning behind the rating.
In order to make informed decisions, combine analyst opinions with your own research—such as reviewing earnings reports, fundamentals, or peer comparisons.
As a result, you can use analyst ratings as part of your toolkit, but not your only guide.
FAQ
Wall Street analysts usually work for investment banks and may have closer relationships with companies, while independent analysts are unaffiliated and may provide more objective opinions. Both can offer value, but comparing perspectives helps balance potential bias.
Yes, ratings can change quickly—especially after earnings reports, major news, or economic shifts. These updates are often released before the market opens to influence trading decisions.
There’s no fixed schedule, but many analysts update their ratings quarterly after earnings calls. Sudden news like executive changes or legal issues can also trigger off-cycle updates.
No, most analyst ratings focus on larger, more widely followed companies. Small-cap or international stocks often lack regular coverage.
Price targets show where an analyst believes the stock will trade within a specific period—usually 12 months. It offers a sense of expected growth or downside.
Most ratings are based on fundamentals, like earnings, revenue, and market outlook. Some analysts may incorporate technical trends, but it’s not their primary method.
Each platform may use a different sample of analysts or weighting system. For example, one might include 10 analysts, while another includes only the top five.
“Outperform” suggests the stock is expected to do better than its sector or benchmark index. “Underperform” means it may lag behind the market.
Both can be useful depending on the context. Upgrades may highlight hidden upside, while downgrades often flag risk before the market reacts.
Some brokerages like Fidelity or E*TRADE provide access to institutional research for free. Others require a subscription or premium account.
Analyst ratings focus on a company’s stock performance. Credit ratings (from firms like Moody’s or S&P) assess a company’s debt and default risk.
