Table Of Content
What Is Investing.com?
Investing.com is one of the best free platforms for fundamental analysis and portfolio management.
The platform provides financial news, market data, and analysis across various asset classes, including stocks, bonds, commodities, and currencies.
Investing.com features tools like real-time market data, an economic calendar, interactive charts, and stock analysis.
It offers free and premium features, with premium plans unlocking deeper analysis, advanced tools, and real-time data from multiple markets.
Plan | Monthly Subscription |
|---|---|
InvestingPro | $15.99
$120 ($9.99 / month)
if paid annually |
InvestingPro+ | $39.99
$300 ($24.99 / month) if paid annually |
How to Research Stocks with Investing.com
Earnings reports provide investors with essential data regarding a company's financial performance.
With Investing.com, you can access detailed financial statements and earnings updates to evaluate the health of a business.
1. Leverage Earnings Reports for Company Insights
Earnings reports provide investors with essential data regarding a company's financial performance. With Investing.com, you can access detailed financial statements and earnings updates to evaluate the health of a business.
Earnings Surprise: Assess if a company exceeded or missed earnings expectations, helping investors gauge market sentiment.
Guidance: Pay attention to the company's forward guidance, offering insight into future revenue and profit projections.
Management Commentary: Read statements from executives to understand their views on future growth, risks, and opportunities.

-
Example
An investor looking for high-growth companies could filter earnings results to find those with significant earnings surprises and positive forward guidance. For example:
Earnings Surprise: 10% higher than expectations
Guidance: Positive revenue growth expected next quarter
Management Outlook: Emphasizing expansion into new markets
This strategy helps identify companies with strong prospects and confident management.
2. Utilize the Stock Screener for Custom Research
Investing.com’s stock screener allows users to filter stocks based on a range of criteria, such as financial metrics, sector, and market cap, helping to match stocks with your investment strategy.
Sector & Industry: Filter stocks by sectors like technology, healthcare, and energy.
Market Cap: Choose between small, mid, or large-cap stocks based on your risk tolerance.
Valuation: Screen for stocks that meet specific valuation criteria like P/E ratio or price-to-book ratio.

-
Example
If an investor is interested in growth stocks in the technology sector, they might filter for:
Market Cap: Over $10B
Sector: Technology
P/E Ratio: Below 20
This approach identifies growth opportunities in established sectors, ensuring the stocks meet fundamental value criteria.
3. Use Real-Time Market Data for Timely Decisions
Investing.com provides real-time data across multiple financial instruments. Real-time data is vital for tracking stock movements, identifying trends, and making timely decisions.
Stock Quotes: Get up-to-date price movements and trading volume.
Market Movements: Stay updated with real-time market data on major indices, stocks, and commodities.
Volatility Alerts: Set up alerts for stock price movements to stay informed about rapid price changes.

4. Follow Analyst Ratings and Research
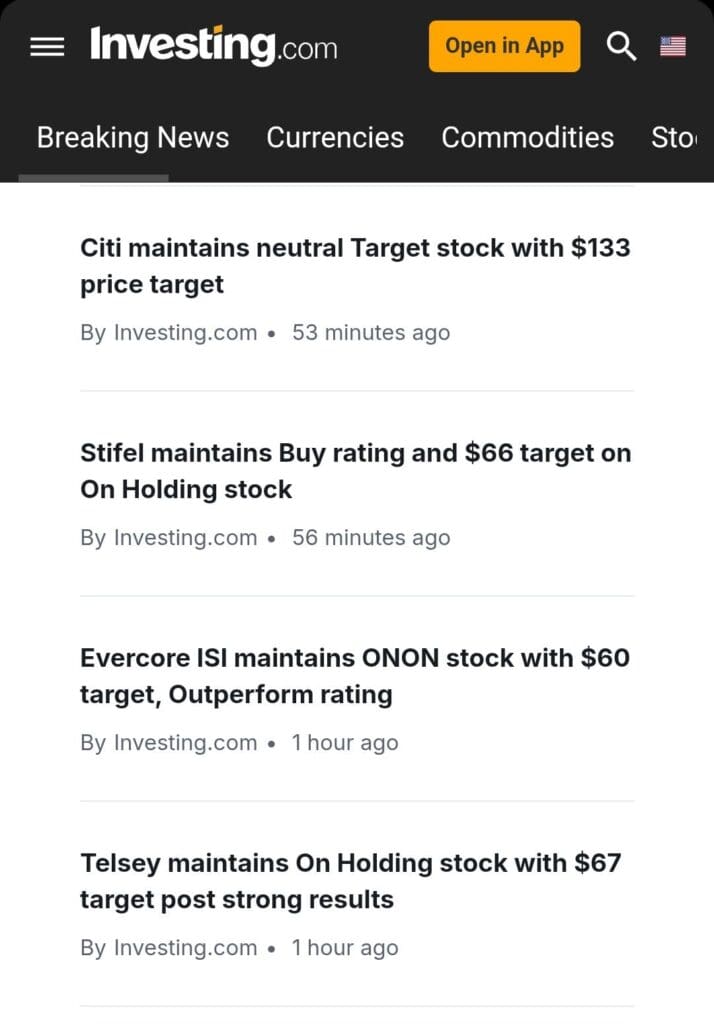
Investing.com provides access to stock analyst ratings, which offer insights into how experts view a particular stock. This feature allows you to see analyst upgrades, downgrades, and sentiment.
Stock Analyst Ratings: Evaluate whether stocks are rated as “Buy,” “Hold,” or “Sell” by experts.
Recent Changes: Watch for changes in analyst ratings, as these can indicate shifts in market sentiment.
Sector-Specific Insights: Follow analyst insights in sectors you are invested in for targeted analysis.

5. Interactive Financial Charts for Visual Analysis
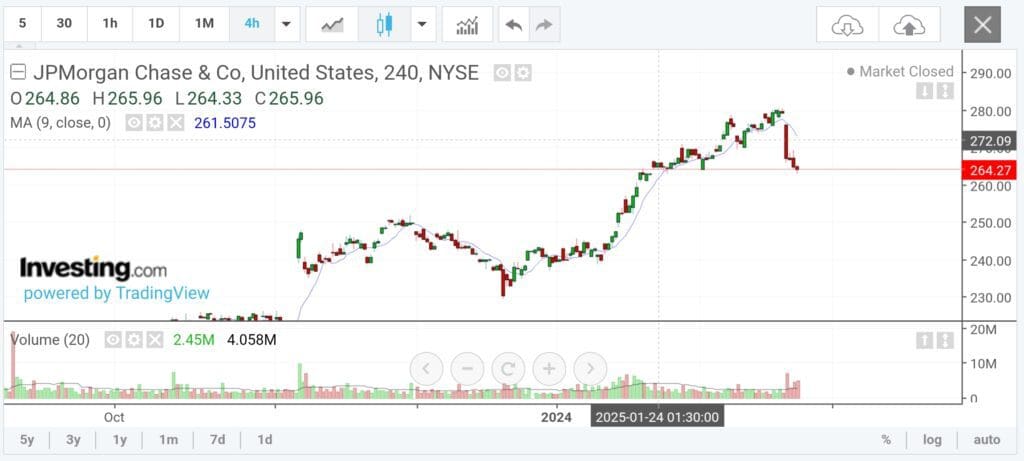
Investing.com offers customizable financial charts that help investors visually track stock performance over time. These charts allow you to analyze price movements, technical indicators, and historical data.
Customizable Chart Types: Choose between candlestick, bar, and line charts for different insights.
Time Frame Selection: Adjust the time frame to analyze short-term or long-term trends.
Technical Indicators: Apply indicators like moving averages (MA), Relative Strength Index (RSI), and MACD to assist in decision-making.

6. AI-Powered Stock Picks (AI ProPicks)
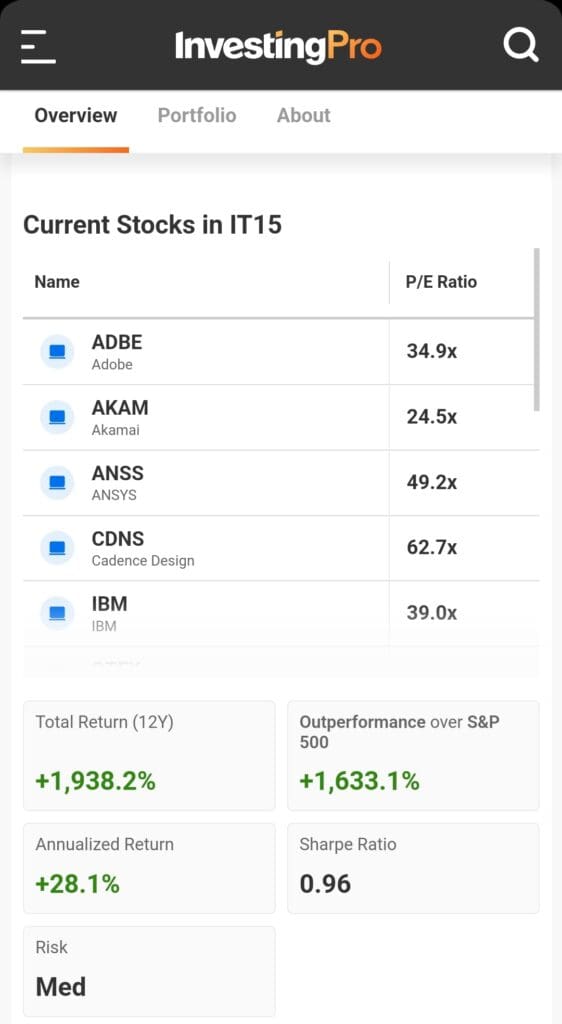
Investing.com’s AI ProPicks uses artificial intelligence to analyze vast amounts of market data and recommend stocks with the potential to outperform the market. This feature helps investors by automating stock selection based on patterns, historical performance, and key financial trends.
Pattern Recognition: AI identifies stocks that exhibit patterns suggesting strong future performance.
Market Outperformance: Focuses on stocks with the highest potential to outperform major indices like the S&P 500.
Sector & Trend Analysis: AI scans various sectors for emerging trends and growth opportunities.

7. Fair Value Gap Analysis for Stock Valuation
The Fair Value Gap Analysis compares a stock’s market price with its estimated intrinsic value, helping investors identify whether a stock is undervalued or overpriced. This tool can be particularly useful for value investors looking to find potential bargains or avoid overpaying for stocks.
Undervalued Stocks: When the stock price is significantly lower than its intrinsic value, it may indicate a buying opportunity.
Overpriced Stocks: When the stock price is above its intrinsic value, it may signal an overpriced stock that could face price corrections.
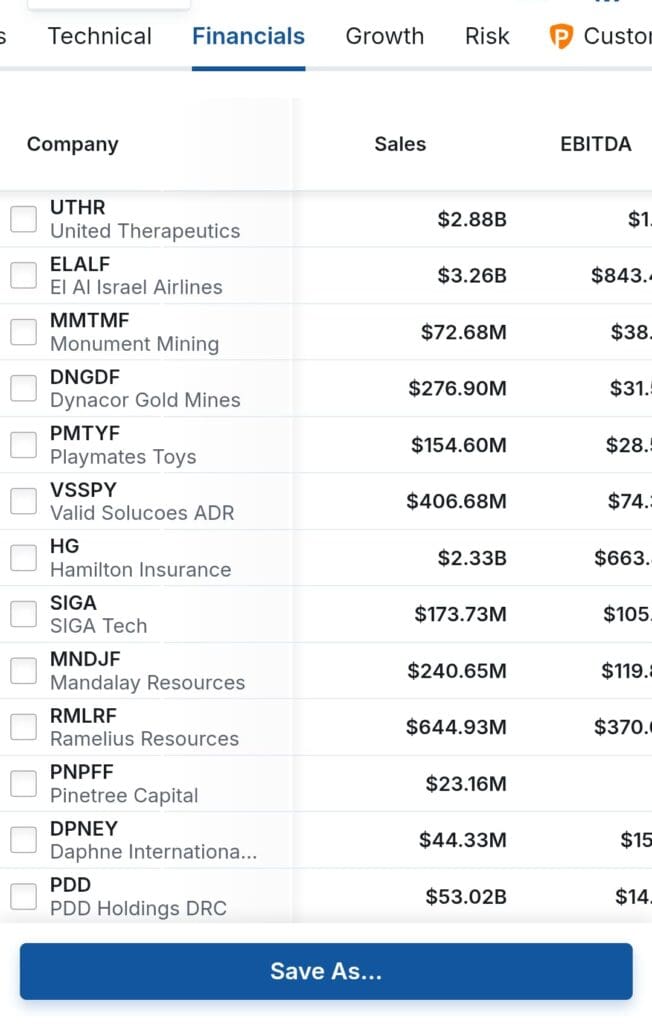
8. Company Financial Data for In-Depth Analysis
Investing.com provides detailed financial data for individual companies, including income statements, balance sheets, cash flow statements, and key financial ratios.
Income & Cash Flow: Examine earnings, revenues, and operating cash flows to assess profitability.
Balance Sheets: Analyze assets, liabilities, and equity for a comprehensive view of financial health.
Key Financial Ratios: Review profitability ratios (like ROE), liquidity ratios, and efficiency metrics to evaluate company performance.
-
Example
An investor evaluating a company in the healthcare sector might analyze its quarterly income statement, focusing on revenue growth and profitability.
They could also check cash flow from operations to assess how effectively the company generates cash.
9. Sector Ranking System for Industry Comparison
Investing.com’s Sector Ranking System allows investors to compare stocks within a specific industry, ranking them based on key financial metrics like profitability, growth, and valuation. This system helps investors identify the strongest companies within a sector, making it easier to pick industry leaders.
Profitability: Measures how well companies within the sector are generating profit.
Growth: Evaluates the expected growth of companies within the sector.
Valuation: Compares stock prices relative to earnings, sales, and book value.
-
Example
An investor interested in the technology sector can use the Sector Ranking to compare companies like Apple, Microsoft, and Google.
By looking at their rankings, the investor can spot which companies are leading in profitability and growth, and therefore, more likely to continue performing well.
10. Company Health Scores for Quick Assessments
Investing.com provides a Company Health Score that evaluates a stock’s overall financial stability using key metrics such as profitability, growth potential, and liquidity. This feature gives investors an at-a-glance understanding of a company’s financial health without diving too deep into its financial statements.
Profitability: Measures how efficiently the company generates profit.
Growth Potential: Evaluates how well the company is expected to grow in the future.
Liquidity: Assesses the company's ability to meet its short-term obligations.

-
Example
An investor looking for strong, stable companies might focus on stocks with high Company Health Scores.
For instance, if a stock in the healthcare sector has a high score, it may indicate strong financial health and robust growth potential, making it a more attractive investment.
FAQ
Investing.com provides a comprehensive suite of tools for stock research, including real-time market data, a stock screener with 1,200+ metrics, and detailed company financials. It also offers AI-powered stock picks, company health scores, and sector rankings to help guide investment decisions.
AI-powered stock picks use advanced algorithms to analyze vast amounts of market data, identifying stocks with the potential to outperform the market. This feature helps investors save time by providing curated stock recommendations based on data-driven insights.
Yes, the stock screener on Investing.com is highly customizable, allowing you to filter stocks based on various financial metrics like P/E ratio, market cap, and dividend yield. You can tailor the filters to match your investment strategy.
Company health scores are based on a company's profitability, liquidity, and growth metrics, offering a quick snapshot of its financial health. While they provide valuable insights, it’s recommended to combine them with detailed financial analysis for a more comprehensive evaluation.
The stock comparison tool allows you to compare multiple stocks side by side based on various metrics, such as earnings growth, P/E ratios, and debt levels. This is useful when evaluating companies within the same sector or industry.
Yes, Investing.com provides real-time market data for stocks, commodities, indices, and currencies. This allows investors to stay updated on market movements and make timely decisions.
The economic calendar on Investing.com provides a schedule of upcoming economic events that could impact the markets. By tracking key events like earnings reports or interest rate decisions, investors can anticipate market movements and adjust their strategies accordingly.
Yes, Investing.com provides features like the Fair Value Gap Analysis, which compares a stock’s market price to its intrinsic value. This tool helps identify undervalued or overpriced stocks based on financial models and market data.
