The TradingView Stock Screener is a versatile tool that empowers investors to filter and discover stocks based on specific criteria like performance, fundamentals, technical indicators, and more.
It’s particularly useful for traders looking for customized filters and quick access to market insights without requiring a premium plan.
Plan | Monthly Subscription | Promotion |
|---|---|---|
Trading View Essential | $14.95
$108 ($9 / month) if paid annually | 30-day free trial |
Trading View Plus | $29.95
$180 ($14.95 / month) if paid annually
| 30-day free trial |
Trading View Premium | $59.95
$432 ($23.98 / month) if paid annually | 30-day free trial |
Trading View Expert | $119.95
$1,199 ($99.95 / month) if paid annually | N/A |
Trading View Ultimate | $239.95
$2,399 ($199.95 / month) if paid annually | N/A |
Best TradingView Screener Features
TradingView’s free stock screener allows users to filter assets across various categories, helping investors identify opportunities that align with their trading strategies.
Key features include real-time market data (with some delays), customizable filters, and an intuitive user interface, perfect for both beginner and seasoned investors.
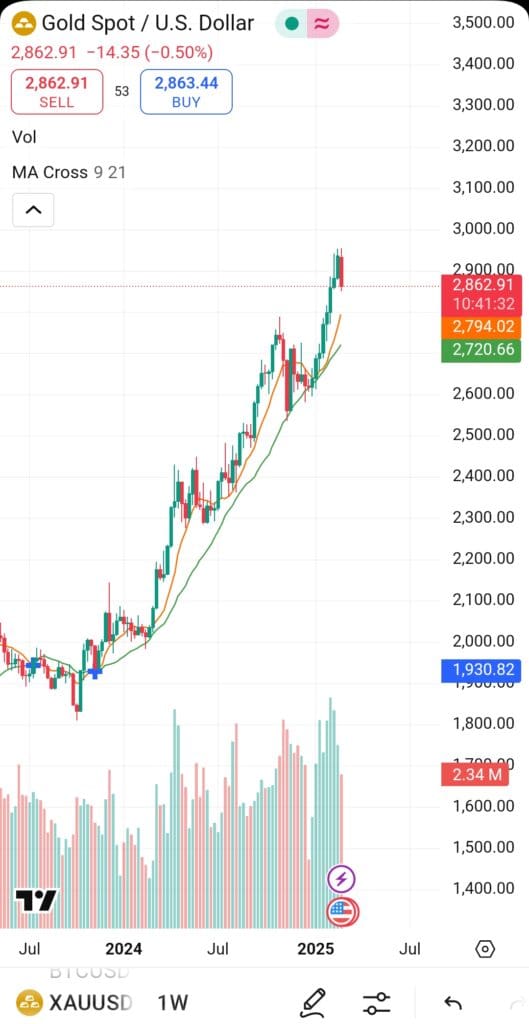
1. Technical Analysis Screening
TradingView's free plan offers robust tools for screening based on technical indicators, allowing traders to filter stocks based on price action and chart patterns.
Moving Average Crossovers: Look for stocks in which the short-term moving average crosses above the long-term moving average, signaling a potential buying opportunity.
Relative Strength Index (RSI): The RSI filters stocks that are overbought or oversold, helping traders identify potential trend reversals.
MACD (Moving Average Convergence Divergence): Filter stocks where the MACD line crosses above or below the signal line, indicating momentum shifts.
-
Example
A trader is looking for potential buy signals based on technical indicators. They set the screener as follows:
RSI: Below 30 (indicating oversold conditions)
MACD: Signal line crossover
Moving Averages: 50-day MA crosses above 200-day MA
This setup helps identify stocks that may be undervalued and showing bullish momentum for entry.
2. Performance Screening
TradingView has a great free screener that allows users to filter stocks based on their recent performance, helping investors identify top-performing assets or those poised for recovery.
Year-to-Date (YTD) Performance: Filter stocks with the best YTD performance to capture upward momentum.
Price Change (%): Screen for stocks with significant daily or weekly price changes, signaling potential volatility and trading opportunities.
Volatility: Use the volatility filter to find stocks with high price fluctuations, useful for active traders seeking opportunities to capitalize on market swings.

-
Example
A day trader is looking for volatile stocks to trade during the day. They configure the screener as follows:
Price Change (1-day): Over 5%
Volatility: High
YTD Performance: Positive
This helps the trader focus on stocks that are experiencing large movements, which are ideal for short-term trades.
3. Volume Screening
Volume-based screening is an essential feature for traders looking to analyze market activity and identify stocks that have significant liquidity or unusual trading volume.
Average Volume: Filter stocks based on their average trading volume over a specified period, ensuring you focus on liquid assets.
Current Volume: Use this filter to find stocks with volume spikes that may indicate a breakout or breakdown.
Volume-to-Price Ratio: Combine volume with price action to find stocks showing significant trading activity at key support or resistance levels.

-
Example
A swing trader is looking for stocks that are starting to experience increased trading activity. They set the following filters:
Average Volume: Over 500,000 shares/day
Current Volume: 2x average
Volume-to-Price Ratio: Above 1.5
This helps the trader find stocks that are starting to pick up volume, which could signal the start of a trend.
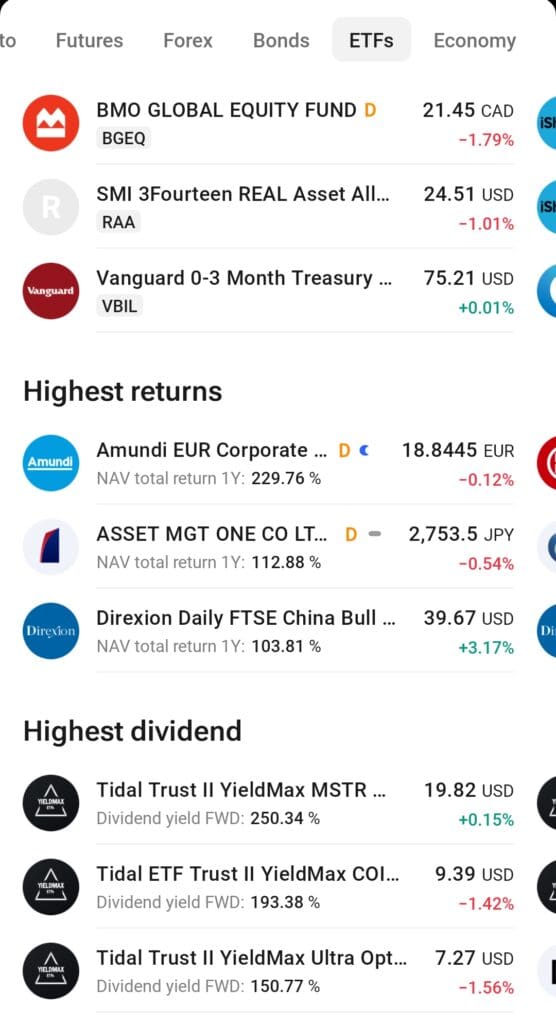
4. Dividend Screening
TradingView offers a powerful dividend screening tool for investors focused on income generation. This feature helps identify stocks with attractive dividend yields, sustainable payouts, and consistent dividend growth.
Dividend Yield: Filter for stocks with a high dividend yield to ensure steady income from your portfolio.
Payout Ratio: This metric allows you to assess how sustainable a company's dividend payments are. Lower ratios often indicate better growth potential.
Dividend Growth: Look for companies with a history of increasing dividends, signaling financial health and long-term commitment to shareholders.
-
Example
An income investor is seeking stable, high-yielding stocks with moderate risk. They configure the screener as follows:
Dividend Yield: 4%+
Payout Ratio: <75%
Dividend Growth: Positive over 3 years
This strategy helps investors pinpoint reliable dividend stocks for consistent income generation.
5. Sector and Industry Screening
The TradingView screener includes robust filtering options for sectors and industries, allowing investors to target specific market segments or maintain broad diversification.
Sector Filter: Narrow your search by broad sectors like Technology, Energy, or Consumer Goods, helping you focus on specific market segments.
Industry Filter: Drill down into specific industries (e.g., fintech, renewable energy, semiconductors) for a more focused investment approach.
Diversification Strategy: Use the sector filter to balance your portfolio, including exposure to both defensive and cyclical sectors.
-
Example
An investor looking for tech stocks in the cybersecurity space sets the following:
Sector: Technology
Industry: Cybersecurity
Market Cap: Over $10B
This tailored search helps investors focus on a niche market with potential growth while still considering larger, more stable companies.
6. Analyst Rating & Market Performance Screening
This feature allows users to filter stocks based on analyst ratings and overall market performance, helping investors identify stocks that are recommended by analysts or have shown strong market movement.
Analyst Rating: Filter stocks based on analysts' buy, hold, or sell ratings. You can choose stocks with strong buy recommendations to identify potentially strong investments.
Performance Percentage (Perf %): Track stocks that have outperformed or underperformed in recent periods, helping investors find trending stocks.
Price Change (%): Filter for stocks with significant price movements in the past day, week, or month to catch assets with recent momentum.
Market Cap: Screen for stocks based on market capitalization, ranging from small-cap to large-cap stocks, to match your risk tolerance.
-
Example
An investor looking for high-performing stocks with strong analyst recommendations might filter the following:
Analyst Rating: Buy
Perf %: Over 10% increase in the last month
Market Cap: Over $100B
This setup helps investors focus on large-cap stocks with positive analyst sentiment and strong recent performance.
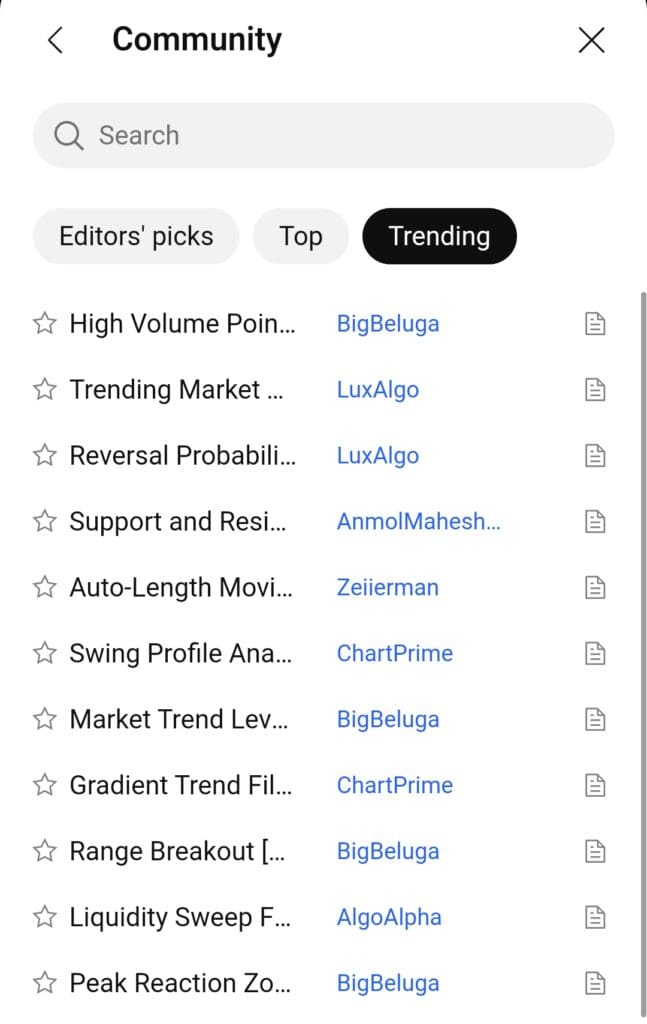
7. Custom Indicator Screening (Using Pine Script)
With TradingView’s, users can also take advantage of custom scripts and indicators via Pine Script to build personalized filters for their screening process.
Custom Pine Script Indicators: Create custom indicators to filter stocks based on specific technical patterns or strategies that aren’t available out-of-the-box.
Price Action Patterns: Use Pine Script to develop filters that scan for specific candlestick patterns like engulfing patterns, doji, or shooting stars.
Automated Strategy Screening: Develop scripts that automatically screen for stocks that meet the conditions of a pre-built strategy, such as breakout or mean-reversion setups.
-
Example
A trader wants to filter for stocks showing a bullish engulfing pattern on the daily chart. They use a custom Pine Script to identify and screen for this pattern, setting the following filter:
Pattern: Bullish Engulfing
Timeframe: Daily
Price Action: Price closes above the previous day's high
This setup automatically identifies stocks that are potentially setting up for upward momentum, based on the chosen technical pattern.
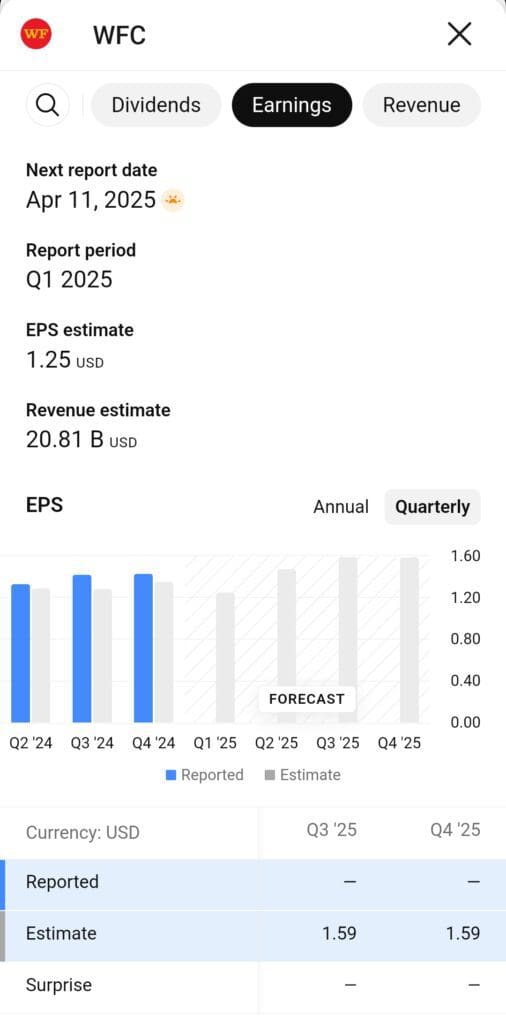
8. Revenue & Earnings Growth Screening
This feature focuses on companies with strong financial performance, helping investors identify stocks that are showing consistent revenue and earnings growth.
Revenue Growth: Screen for companies with high revenue growth over a specific period (quarterly or yearly), highlighting companies with expanding sales.
EPS Diluted Growth: Use this filter to find companies that are consistently growing their earnings per share (EPS), which indicates increasing profitability.
Upcoming Earnings Date: Filter stocks based on their upcoming earnings reports, allowing investors to prepare for potential volatility or growth catalysts.
PEG Ratio: This ratio provides a more balanced look at stock price in relation to earnings growth, helping investors focus on companies with reasonable valuations relative to their growth potential.
-
Example
A growth-focused investor interested in companies showing strong financial performance might set the following filters:
Revenue Growth: Over 15% YoY
EPS Diluted Growth: Positive growth over the past 2 quarters
Upcoming Earnings Date: Within the next 30 days
This helps investors find stocks with strong financial fundamentals and the potential for positive price movement after earnings reports.
9. Price & Index Screening
This feature enables users to filter stocks based on price, index inclusion, and performance within broader market indices, helping investors select stocks that fit their price range or have high index performance.
Price: Filter stocks by their current trading price, from low-priced stocks to high-priced blue-chip companies.
Index: Filter stocks that are part of major indices (e.g., S&P 500, NASDAQ), giving a sense of their performance within large market segments.
Change %: Track stocks that have moved significantly in the past day or week, helping traders catch uptrend or downtrend momentum.
US Market: Focus on stocks listed on U.S. exchanges, providing a more localized selection for U.S.-based investors.
FAQ
The TradingView stock screener provides reliable filtering based on real-time data, but keep in mind that some data may be delayed on the free plan, which could affect timely decisions.
Yes, you can track unlimited stocks within a single watchlist. However, creating multiple watchlists requires a paid plan.
TradingView allows you to filter stocks based on a wide range of criteria, including market cap, performance, P/E ratio, dividend yield, and various technical indicators.
Real-time stock data is available, but it’s limited on the free plan. Premium plans offer faster data feeds and more detailed access.
Yes, TradingView offers screeners for stocks, ETFs, bonds, and cryptocurrencies, allowing for a broad range of market analysis.
You can set one active alert at a time in the free plan, notifying you of price movements or specific technical conditions like RSI or moving average crossovers.
Since TradingView is one of the best charting tools, backtesting features are available, the free plan has some limitations. You can use the Pine Script editor to create simple backtests, but advanced backtesting requires a paid plan.
